- Peso standoubt performer versus the Dollar, rising 10% over the Summer
- NAFTA detente may be close at hand which would drive it higher
- Pennant pattern provides technical signal of possible appreciation move

Image © kasto, Adobe Stock
In contrast to most currencies, the Mexican Peso has been rising versus the US Dollar, not falling for most of the summer, and at least one analyst thinks it will continue to rise.
Since June the Peso has risen 10% against the US Dollar as it recovered following a 44% nosedive after Trump announced his presidential run in 2015 and began his anti-NAFTA crusade.
Although trade fears were one reason for the Peso's original fall (political uncertainty leading into the presidential elections another) the rhetoric coming from Donald Trump more recently has improved.
Trump has however confirmed recently that the US and Mexico are "getting closer" to reaching a trade deal, a fundamental factor that could well underpin MXN going forward.
Assuming the two countries wrap up a trade deal soon the Peso could appreciate sharply as the currency makes back the risk premium it has been discounting due to fears of a no-deal NAFTA outcome.
The Peso is undervalued by a considerable amount due to Trump trade fears - circa 30% given the 44% decline minus the 10% rebound, and this is the amount up for grabs if the outcome is a 'happy ending'.
Technical studies also bode well for the Peso's outlook.
Pinchas Cohen, an analyst at Investing.com, notes how the charts are backing up a positive result for the Peso as it is showing a bearish 'pennant pattern', making USD/MXN a compelling strategic opportunity for Cohen.
Pennants are continuation patterns which means they represent pauses in the trend before it resumes - in this case down.
Their name comes from their look which reminds analysts of the triangular pennants which flew from medieval tents during jousting contests. The diagram below shows an example of a bearish pennant.
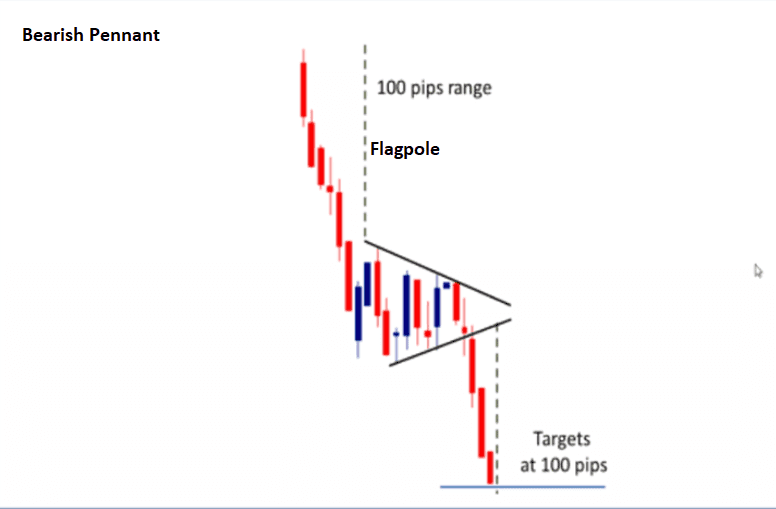
(Image courtesy of investoo.com)
The pennant on USD/MXN is shown on Cohen's chart below.
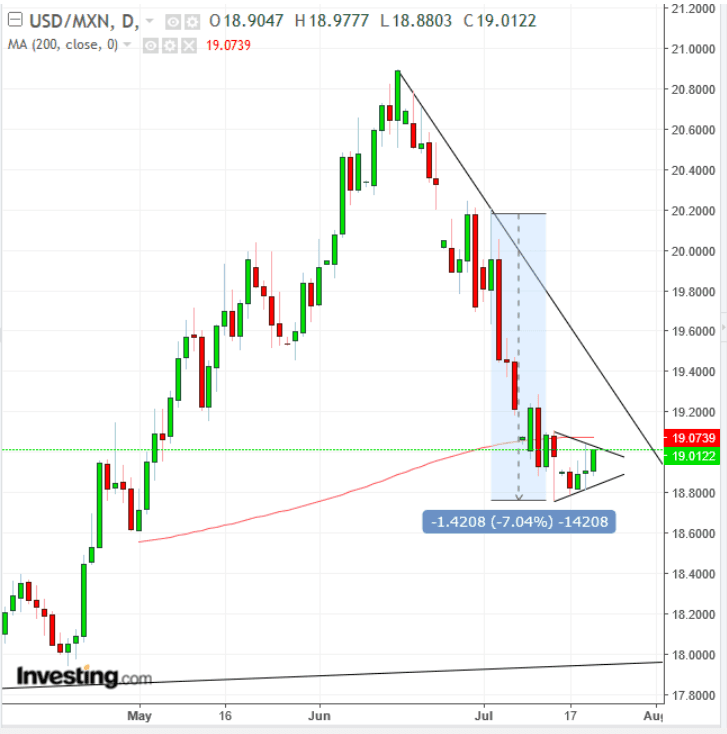
The length of the 'flagpole' which is the steep move prior to the formation of the triangle gives an idea of the length of the follow-through as they are roughly symmetrical.
The probably suggests a move down to at least 18.00, says the analyst.
The fact the pennant is forming just under the 200-day MA further increases the chance of a downside break as prices usually follow the path of 'least resistance'.
Cohen suggests three different approaches to trading the pattern depending on how aggressive traders are.
"Conservative traders would wait for a downside breakout with at least a three-percent penetration and three sessions in which the price remains below the pattern, followed by a return-move that would verify the pennant's integrity, with at least one long, red candle following a green candle," says Cohen.
The analyst says moderate traders might wait for just a two-percent filter, with a return-move for a better entry, but not necessarily for proof of the pattern’s resistance.
"Aggressive traders might risk a short immediately, relying on the trend, the 200 DMA violation and the resistance of the top of the pennant, where it is currently trading," adds Cohen.
Cohen recommends an entry at 18.80, a stoploss protecting losses in the event something goes wrong at 18.8500 and a target at 18.00 giving a risk reward ratio of 1:16.
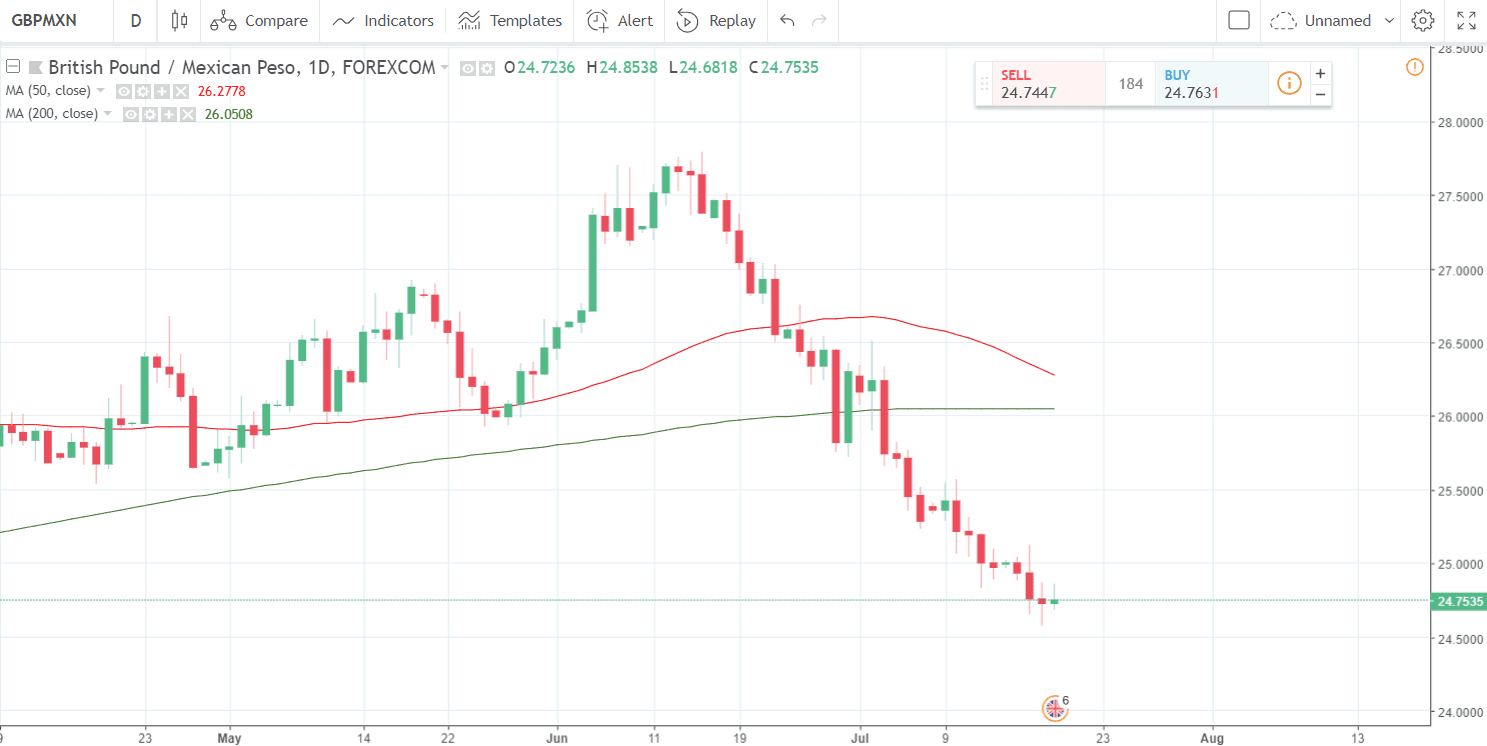
The same pattern has not unfortunately formed on GBP/MXN although it too has been in a downtrend during the summer.
Advertisement
Get up to 5% more foreign exchange by using a specialist provider to get closer to the real market rate and avoid the gaping spreads charged by your bank when providing currency. Learn more here