
The EUR/JPY exchange rate is currently trading at new 6-week high of 131.38, however, its uptrend is tenuous and not expected to last.
Two separate technical analysts have said the uptrend will break and the exchange rate will sell-off in the next few days, to varying depths.
Both analysts use a form of cycle analysis called Elliot Wave analysis, which sees the market as moving in five wave cycles of buying and selling interspersed by three wave corrections.
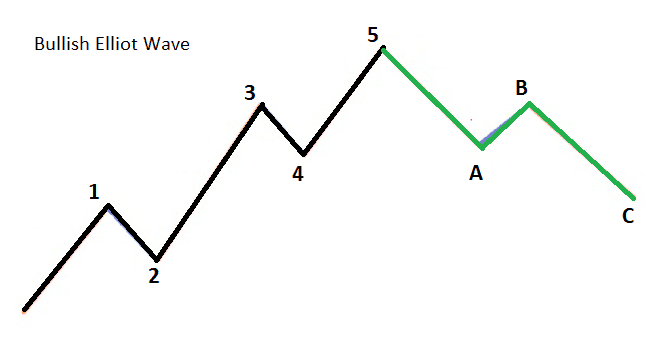
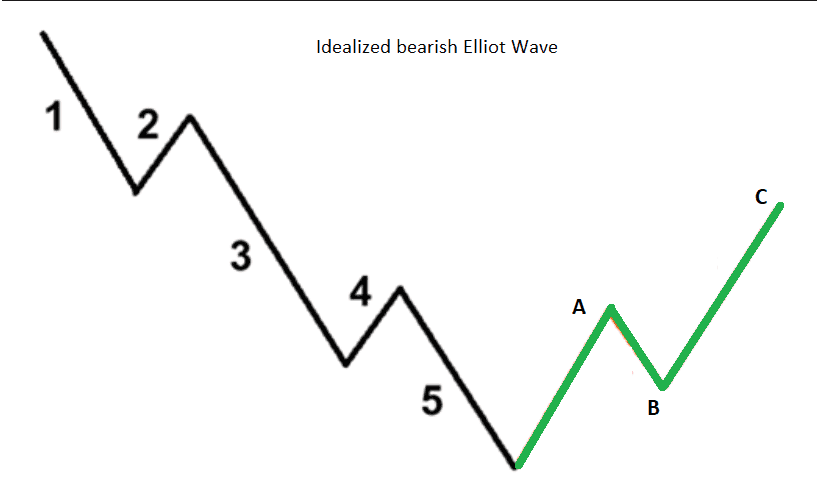
Elliot waves are 'fractal' which means each component wave of a cycle is itself composed of a smaller 5-wave pattern ad infinitum.
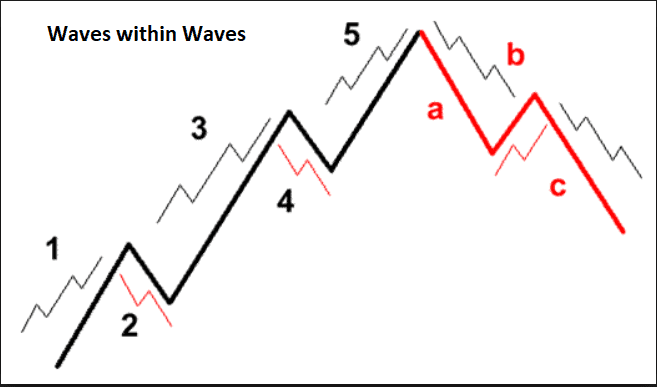
(Image courtesy of babypips)
Hassan Sheikh, a technical analyst at Elliot Wave Forecast sees EUR/JPY as close to achieving - or already in the process of achieving - the peak of wave (v) of a larger wave (V) of a larger wave 1 (see pic below).
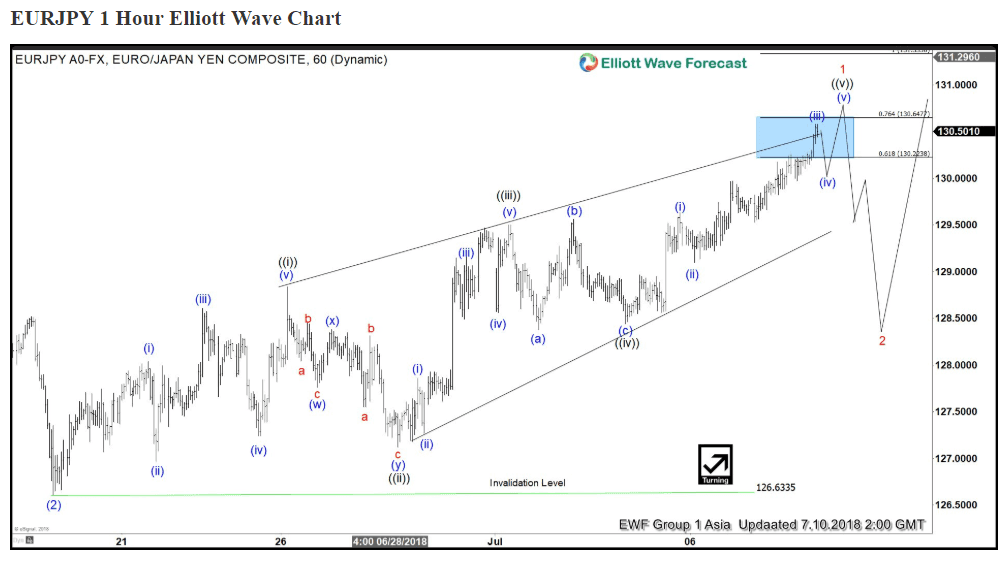
This will be followed by a sell-off as a new larger scale corrective wave 2 unfolds, targeting 128.30. Wave 2 could be a "running flat" correction, says Sheikh, which means the market will recover back up to the current highs after bottoming in the 128s, assuming it gets that low.
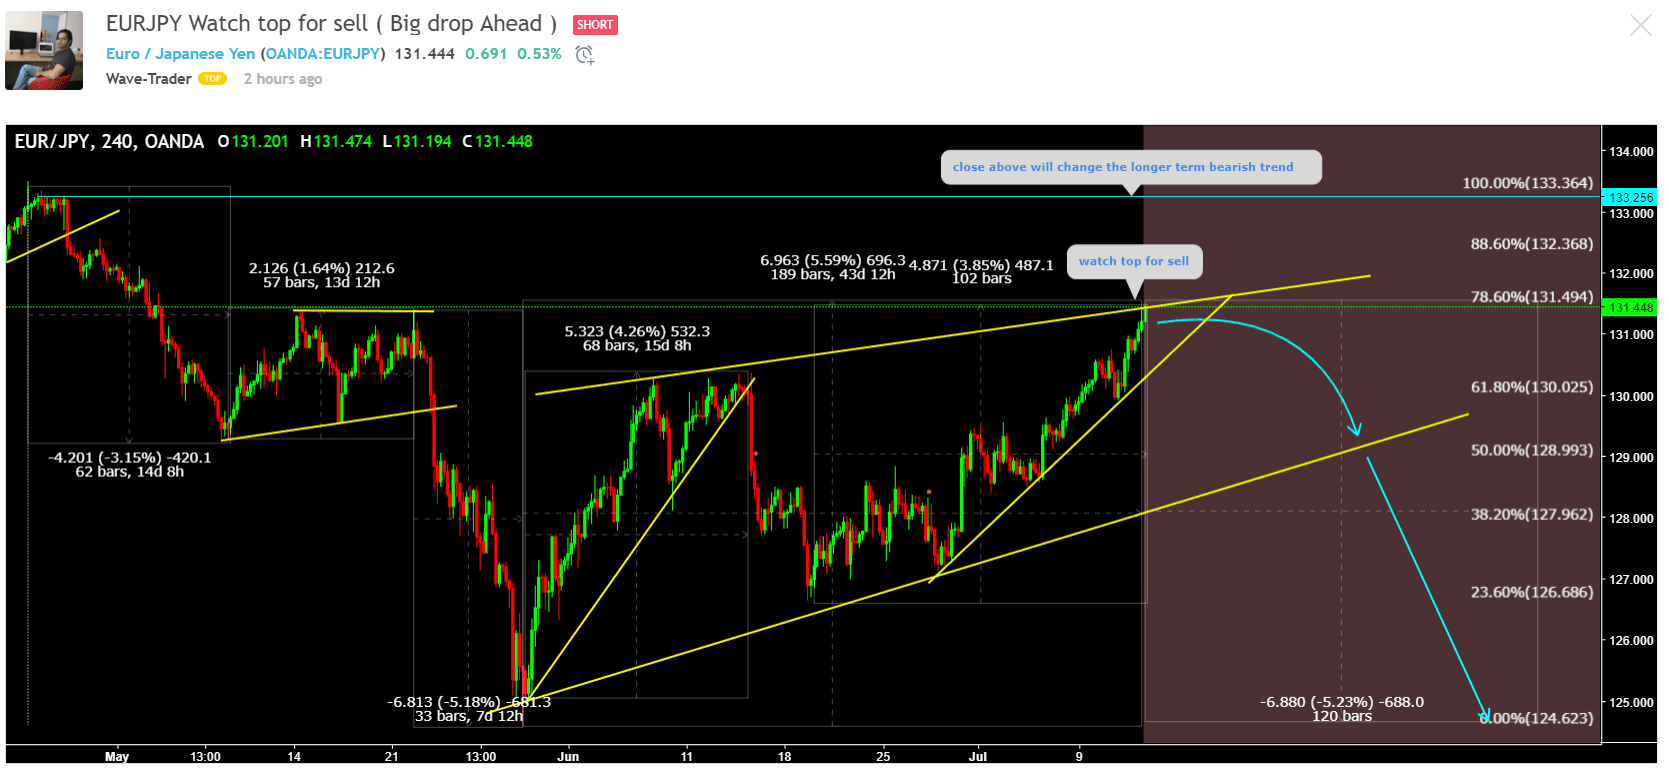
Another wave analyst who calls himself Wave-Trader and is a popular contributor to chart site Tradingview.com, also sees EUR/JPY peaking, although in his case he sees the potential for a more potent sell-off, first to support from the bottom of a range at 129.50 and then 125.00.
"EURJPY is at ideal place for short... Big Drop is ahead on this pair. Don't miss this drop," says a flash note from Wave-Trader.
We add that although the pair is now in the 131s and showing no signs of a reversal yet momentum in the form of RSI (see below) is diverging bearishly with price, since it has not corroborated the new high with equally strong momentum. This is sometimes a sign of underlying weakness and a precursor to more downside.
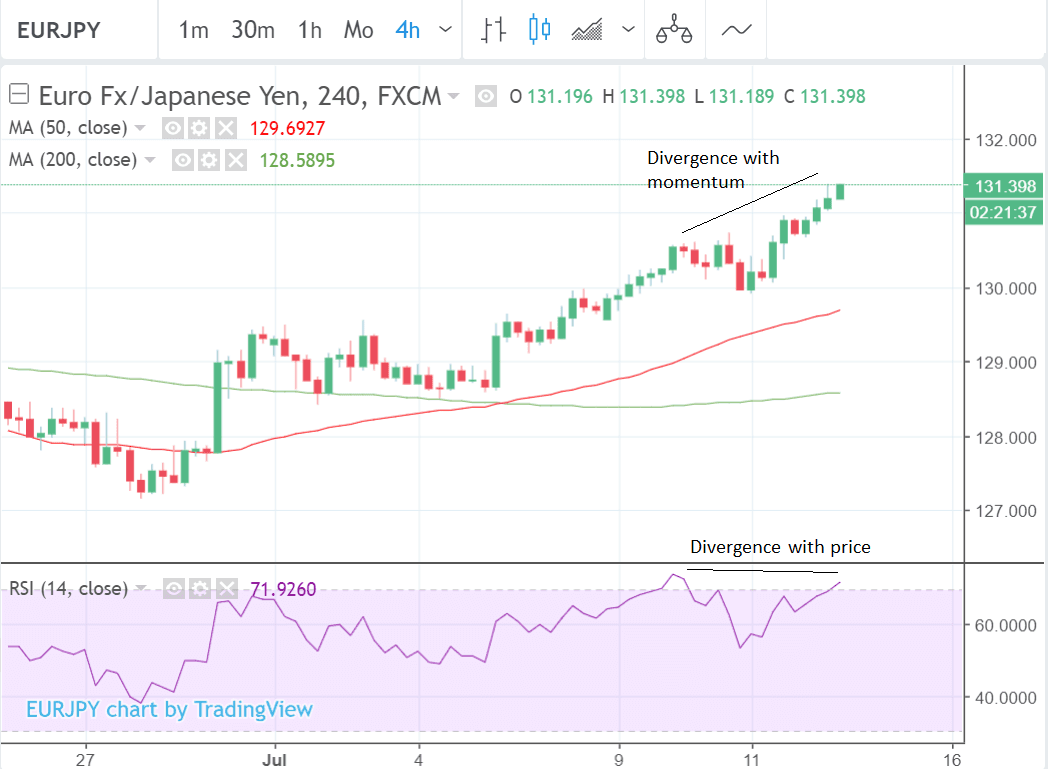
Divergence on its own is not usually enough, however, to make a conviction bearish call, there needs to be corroboration from price action as well.
One of the best indicators to use in combination with Elliot Wave analysis is Japanese candlestick patterns which are strong indicators of when waves are turning.
If the EUR/JPY chart shows a bearish candlestick reversal pattern at the current highs on the 1hr, 4hr or daily chart this will be a strong signal that the wave sequence is reversing and moving down in a bear wave 2 lower.
Below are a selection of the most common bearish candlestick reversal patterns for a quick reference of what to look out for.
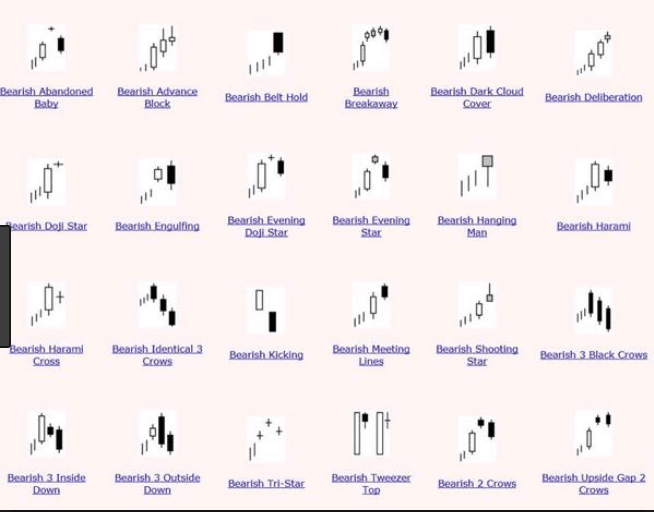
(Image courtesy of Scoopnest.com)