


 GBP
GBP EUR
EUR USD
USD AUD
AUD NZD
NZD ZAR
ZAR CAD
CAD CHF
CHF JPY
JPY


USD/CAD Reverses Losses but Charts Yield Few Clues about whether Bull-run can Endure
- USD/CAD pivots higher after falling to 1.3050.
- Falling oil prices hastened the Loonie's decline.
- Pair is now at a key make-or-break trendline.

© kasto, Adobe Stock
The USD/CAD pair managed a 24hr turnaround midweek, recouping all of its previous losses before going on to reach a new high for August, although the charts are giving off mixed messages about whether this bull-run can endure.
The recovery coincided with more gains for the US Dollar off the back of continued weakness in emerging market currencies, and persisted Thursday despite a downward correction in most other US Dollar exchange rates.
Part of the move was driven by a weak Canadian Dollar. The Loonie fell in tandem with crude oil prices, which declined due to data showing a rise in US crude oil inventories last week that suggested US demand for oil may be declining.
Oil is Canada's biggest export so changes in the price directly effect demand within the economy, as well as the country's "terms of trade", which are an important for determining the fundamental value of a currency.
A trade war tweet from Donald Trump may have further exacerbated the Canadian Dollar's decline and pushed the US Dollar higher, after he said the US was "built on tariffs" and "tariffs are now leading us to great new trade deals."
Large option expiries are another factor that could have impacted upon the pair, with strike prices maturing at USD/CAD: 1.2900 (679M), 1.3050 (1BLN), 1.3160 (308M), 1.3185 (455M) according to data from Reuters.
It is generally accepted that expiries of over 600m can be market moving via a phenomena called 'pinning' or 'gamma explosion'. Pinning happens when option writers try to manipulate the market in favour of their own strike prices in the hope of rendering them worthless to the option holders at expiry.
Gamma explosion occurs when the market moves so far from the strike price option writers give up trying to 'pin' the exchange rate and join the trend instead - and this may have been what helped propel USD/CAD this week as the failure to hold 1.3050, where the majority of options were expiring, turned into a rout.
The push higher means the exchange rate has now reached a key technical trendline on the charts, according to Greg Michalowski, an analyst for liveforex.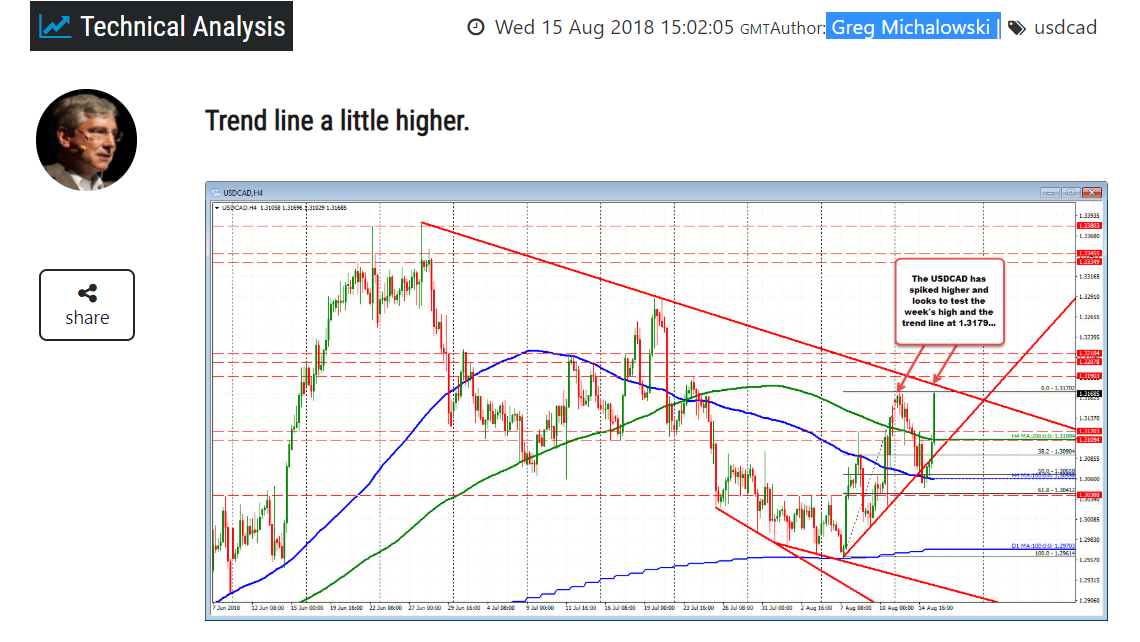
Above: Source: Greg Michalowski.
The trendline is an important level for the pair as a break above it would signal a move into new bullish terrain and probably an extension toward 1.3300. A push above 1.3200 would confirm this.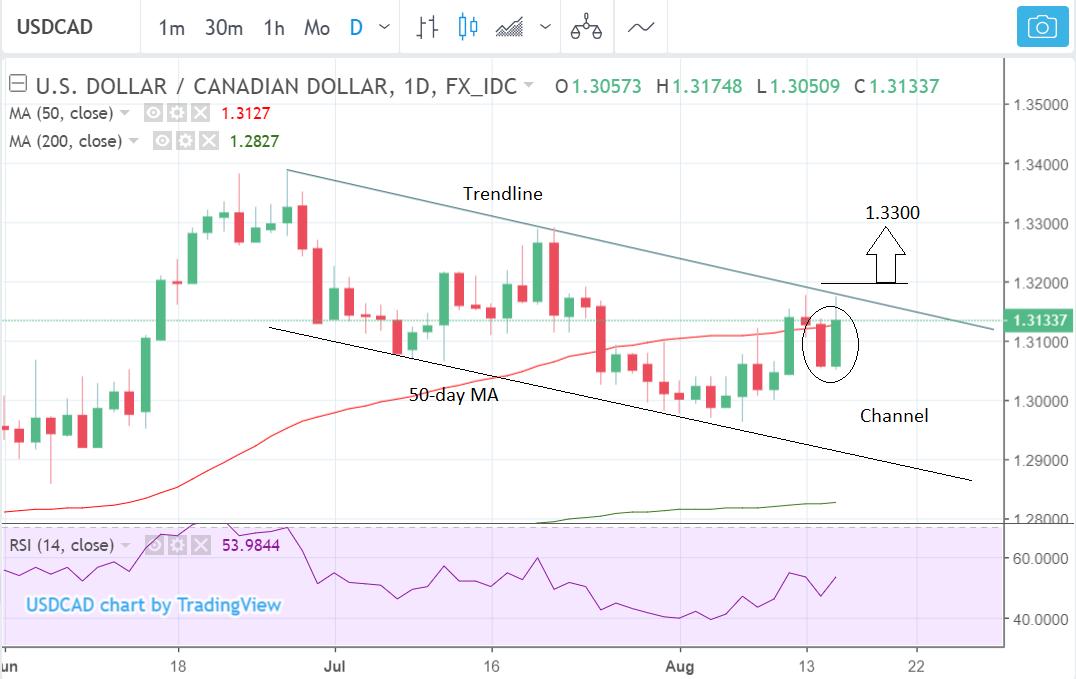
Above: USD/CAD rate shown at daily intervals. Includes relative strength index (RSI)
Generally analysts forecasts prices to move a distance equal to the height of the channel once having broke out from it, in either direction, which also suggests a move up to 1.3300 if the USD/CAD rate breaks from the current channel.
However, a major impediment to continued bullishness is the 50-day moving average situated close to the current market level at 1.3127.
The 50-MA is an obstacle to the emerging trend as it is often the site of major pull-backs, pivots or reversals. Therefore, there is a possibility USD/CAD could turnaround at current highs and resume earlier declines.
Advertisement
Get up to 5% more foreign exchange by using a specialist provider to get closer to the real market rate and avoid the gaping spreads charged by your bank when providing currency. Learn more here