


 GBP
GBP EUR
EUR USD
USD AUD
AUD NZD
NZD ZAR
ZAR CAD
CAD CHF
CHF JPY
JPY


Pound-to-Dollar Chart Giving Off Sell-Signal Despite Market Reaching 'Extreme Lows'
- High probability 3-bar pattern points to further declines.
- Oversold momentum indicators advocate a cautious approach.
- Overall trend points toward a move down to 1.25 in weeks ahead.

© Goroden Kkoff, Adobe Stock
The GBP/USD exchange rate has formed a high probability set-up on the charts that suggests a deeper decline is in the cards for the week ahead.
The bearish chart pattern coincides with mounting fears of a 'no-deal' Brexit, exacerbated this week by comments from Foreign Secretary Jeremy Hunt, who said the risk of 'no-deal' scenario is increasing. British and EU negotiators met to discuss the Irish border issue Thursday.
From a technical perspective, the GBP/USD pair remains in an established downtrend that is biased to continue. As the old adage goes; 'the trend is your friend until the bend at the end'.
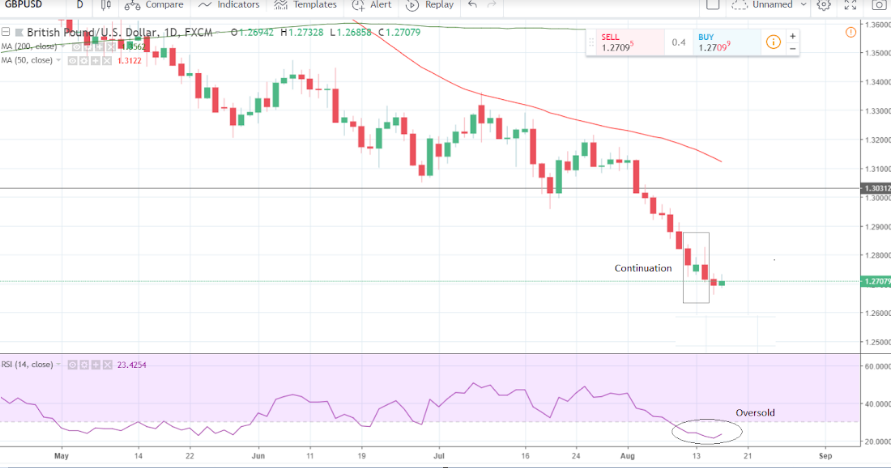
Above: Pound-to-Dollar chart showing average direction movement (ADX) indicator.
It has also now formed another three bar continuation pattern (bordered in grey below), which when combined with a rising Average Directional Movement (ADX) indicator in the lower pane, produces a high-probability - circa 80% - signal of a continued downtrend.
ADX measures how strongly prices are trending regardless of the actual direction. The higher it is, the more strongly prices are trending. The optimum point for traders wishing to catch a trend is when ADX is between 20-40. It was at 32.19 when the pattern completed on Tuesday.
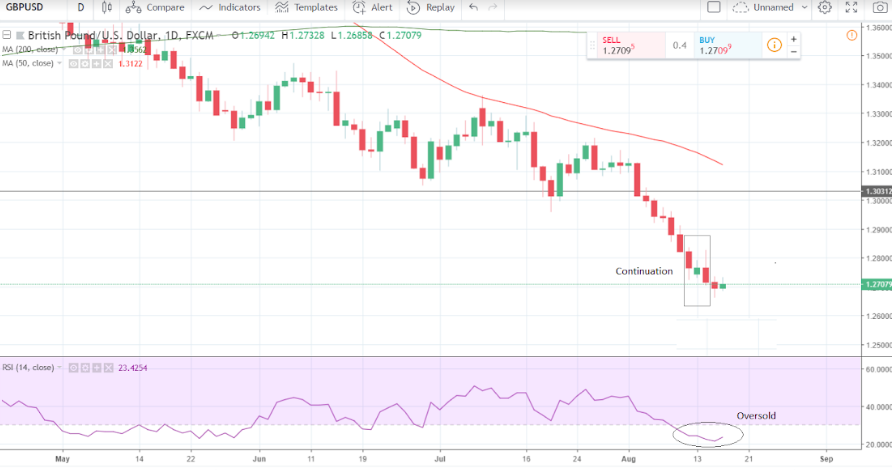
Yet not all indicators are pointing to a continuation of the downtrend. The RSI momentum indicator, for example, is in the oversold region and now indicates the trend lower may be running out of steam.
Above: Pound-to-Dollar chart showing relative strength index (RSI).
On its own, however, the RSI is not enough to cancel out the continuation signal from the 3-bar, but merely to urge some caution in interpreting it. The three-bar pattern is made up of a long down-bar followed by a very short-bodied bar and a further long down-bar.
How low will the market go? The three bar indicates a continuation down to a target between 100 and 150 points below the low of the third and final bar. This suggests a decline to between 1.2605 and 1.2555.
We would look for a break below Wednesday's 1.2661 lows for confirmation of a continuation down to the target zone.
The GBP/USD exchange rate was quoted at 1.2708 at 13.50 B.S.T, on Thursday, August 16, up 0.13% on the day.
Advertisement
Get up to 5% more foreign exchange by using a specialist provider to get closer to the real market rate and avoid the gaping spreads charged by your bank when providing currency. Learn more here