


 GBP
GBP EUR
EUR USD
USD AUD
AUD NZD
NZD ZAR
ZAR CAD
CAD CHF
CHF JPY
JPY


Euro-to-Dollar Rate Rejected By 'Cloud' as Outlook Turns Bearish
- EUR/USD is pushing lower after rejection by chart "cloud"
- EUR/USD attempting a break below the 61.8% fibo line.
- Closing in on 1.1859, a make-or-break for Ellioticians.
© European Central Bank
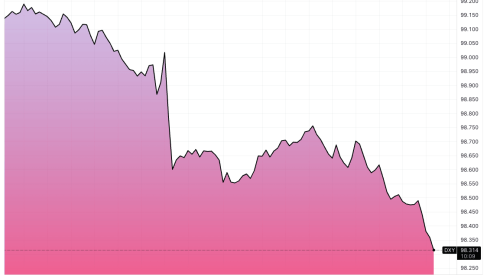
The Euro-to-US Dollar rate has been rejected by the bottom of the Ichimoku cloud and is threatening to break below a key level at 1.1616, according to a Reuters report.
The 1.1616 level is the 61.8% Fibonacci retracement of the rally between June's 1.1508 low and July's 1.1790 high.
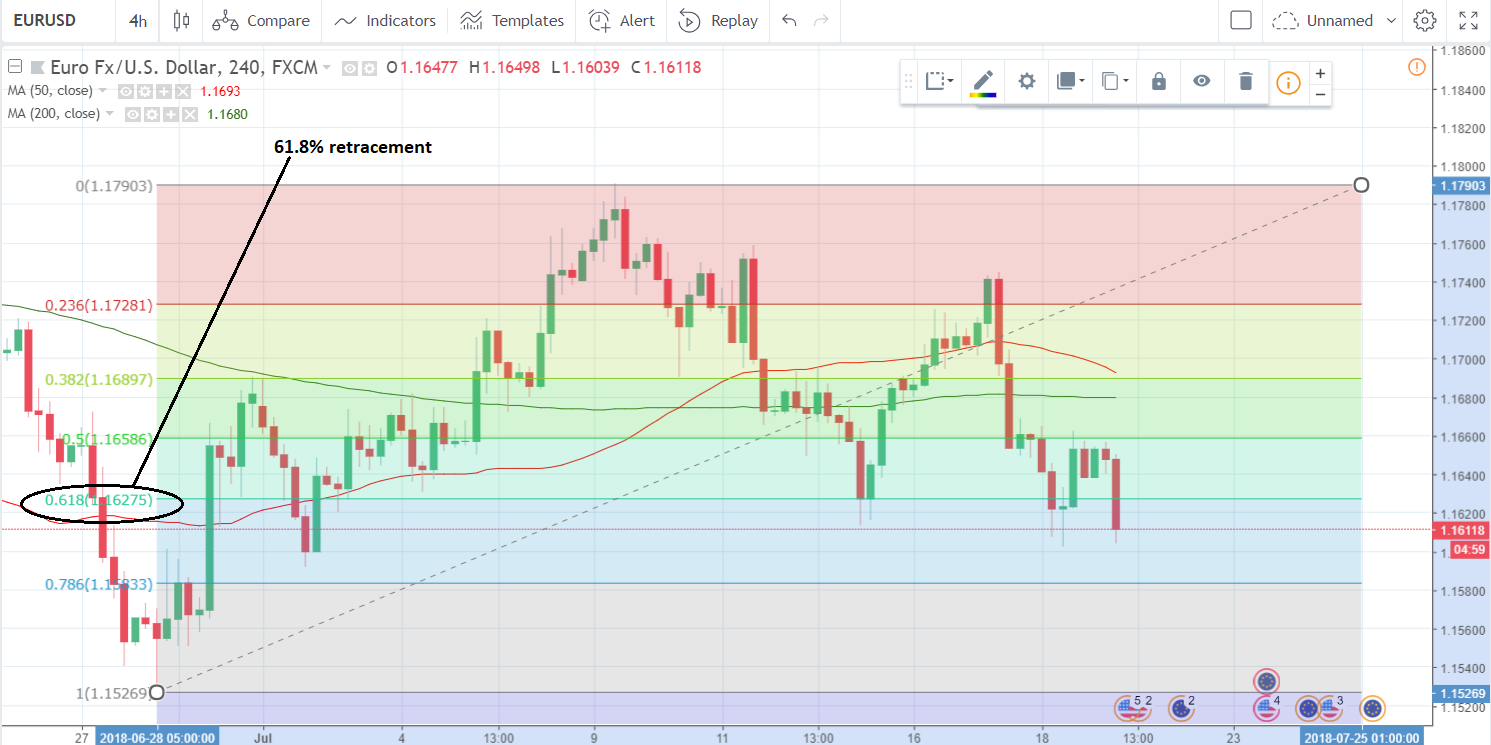
Above: EUR/USD chart highlighting the 61.8% retracement level.
Corrections have a habit of ending at this or the 50% retracement (midpoint) and resuming their previous uptrend. On the flip-side, if prices break below the 61.8% retracement level it is often seen as a bearish sign, and that bullish efforts to make a 'last stand' have failed.
In the case of EUR/USD Miller sees a break below 1.1616 as giving a clear signal of greater impending weakness, however, he would ideally wish to see a daily close below the level for confirmation (the pair is currently trading below it at 1.1611 but has not yet closed below it).
"Once there is a daily close below 1.1616 Fibo, this will weaken the market," says Martin Miller, a correspondent at Reuters. "The pair ran into resistance on the topside from the bottom of the Japanese Ichimoku chart at around 1.1700 and has since sold off." Another feature of the Ichimoku charts, the Kijun line, is currently at the 1.1681 level and "should also cap," Miller also says. "EUR/USD cloud rejection gives bears a clear run at key Fibo."
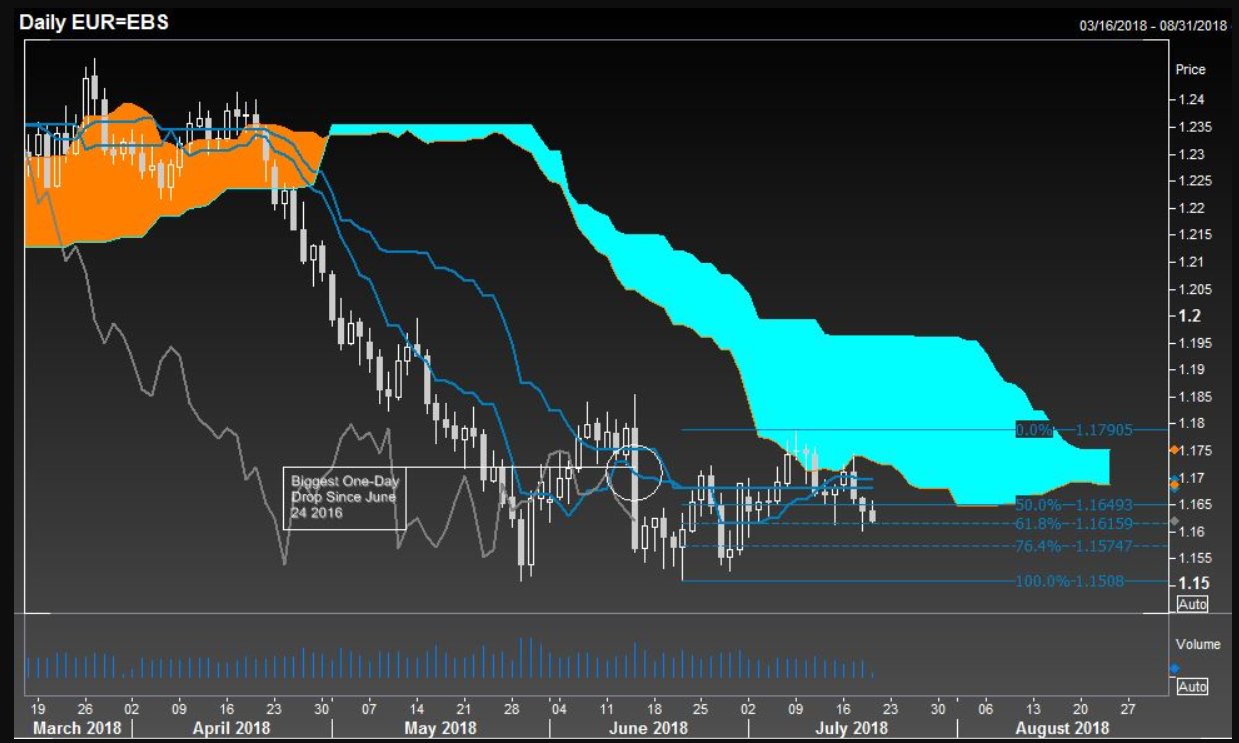
Above: EUR/USD chart showing Ichimoku cloud.
The pair is also approaching another important bearish level at 1.1589 which was highlighted in a recent article by Pound Sterling Live, covering Elliot Wave analysis.
Drawing on analysis from wave expert Alex Geuta of broker Liteforex, the article noted how the market was rising in a wave correction (wave 4 for Elliot Wave buffs) of the downtrend which could reach 1.1850 as long as it remained above the 1.1589, but if ti broke below, it would be a signal the next wave of selling (wave 5) with a downside target of between 1.1320 and 1.1439.
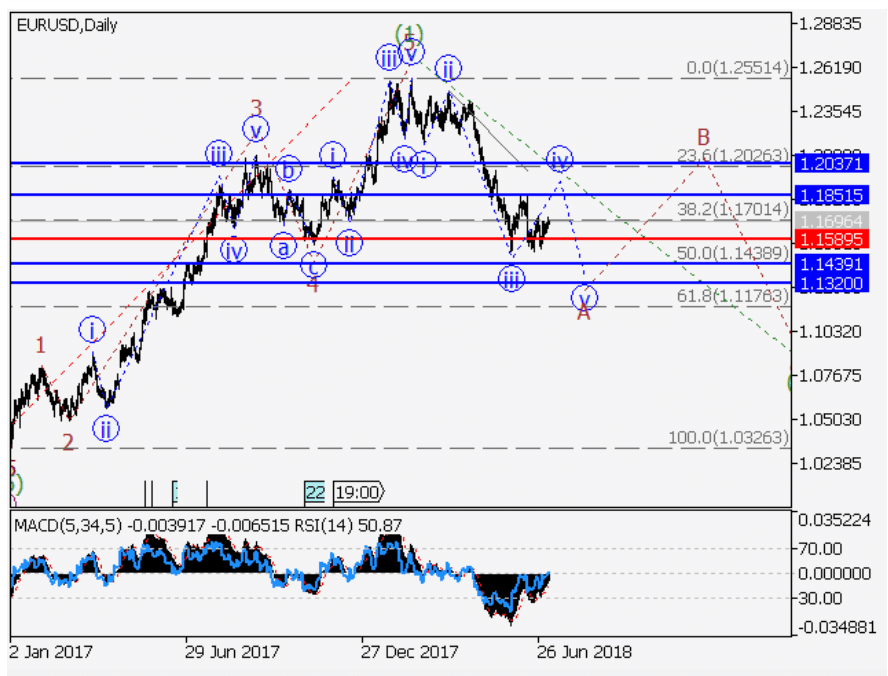
Above: EUR/USD exchange rate shown at daily intervals.
Advertisement
Get up to 5% more foreign exchange by using a specialist provider to get closer to the real market rate and avoid the gaping spreads charged by your bank when providing currency. Learn more here