


 GBP
GBP EUR
EUR USD
USD AUD
AUD NZD
NZD ZAR
ZAR CAD
CAD CHF
CHF JPY
JPY


USD/JPY Breaks Out to New Highs as Continuation Pattern Suggests Even More Gains Ahead
- USD/JPY almost touches 112 as market rises to new 2018 high.
- Bullish continuation patterns suggests even more gains in store.
- Potential run higher to 113.50 on the cards.

© RCP, Adobe Stock
The Dollar has risen to year-highs against the Yen and, judging by the continuation patterns forming on the charts, will probably continue rising.
USD/JPY finally broke above a key ceiling midweek, rising to a new 2018 high near 112 as the Dollar advanced against most of its adversaries.
Despite the flight to safety caused by rising tensions over international trade, which would normally be supportive of the Japanese currency, the Dollar outperformed due to investors' preference for US treasury bonds as a safe haven during times of crisis.
The daily chart has now formed a relatively reliable three-day continuation pattern composed of a long green up day followed by a small-bodied day and then another long green up day (Wednesday's candle), which taken together (circled below) forms a three-bar continuation pattern.
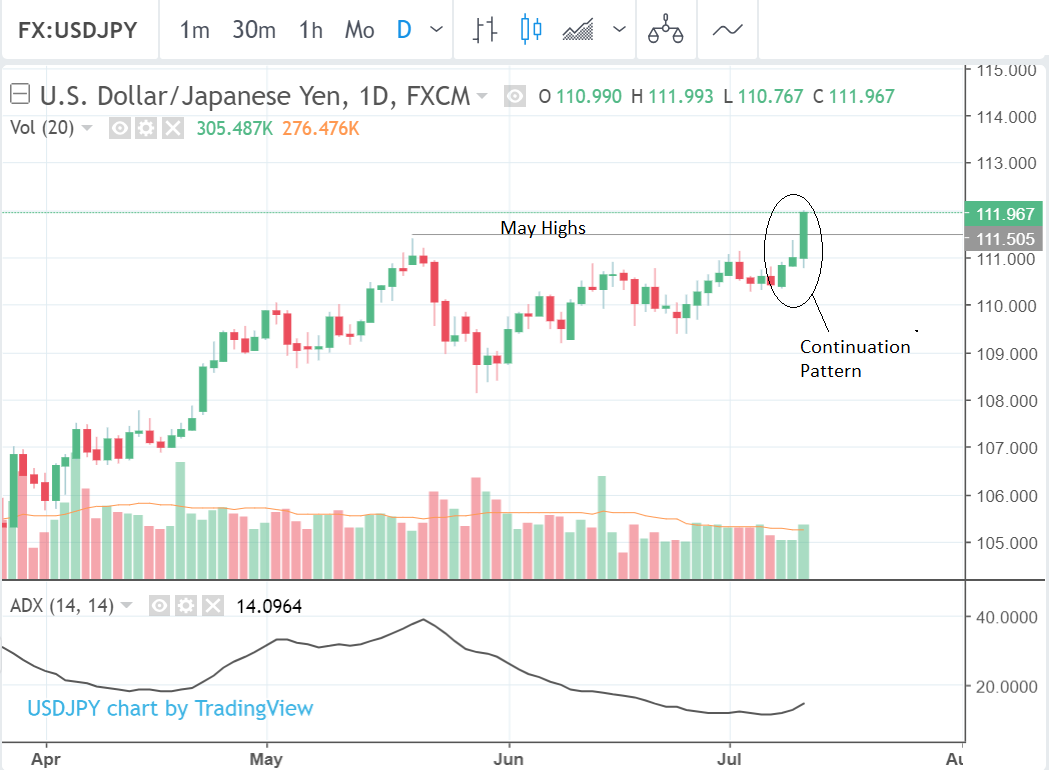
Above: USD/JPY rate shown at daily intervals.
Sadly the pattern does not tick all the boxes of a high probability set-up as the average-directional-index indicator (lower pane) remains a little too low, although it is rising and rising with higher momentum, which is positive.
ADX indicates how strongly the market is trending, regardless of direction. The 3-bar pattern normally forecasts a continuation of about 150 points above the third candle's highs - or 113.50 - if it's correct. Interestingly, the exact same continuation pattern has also formed on the weekly chart below.
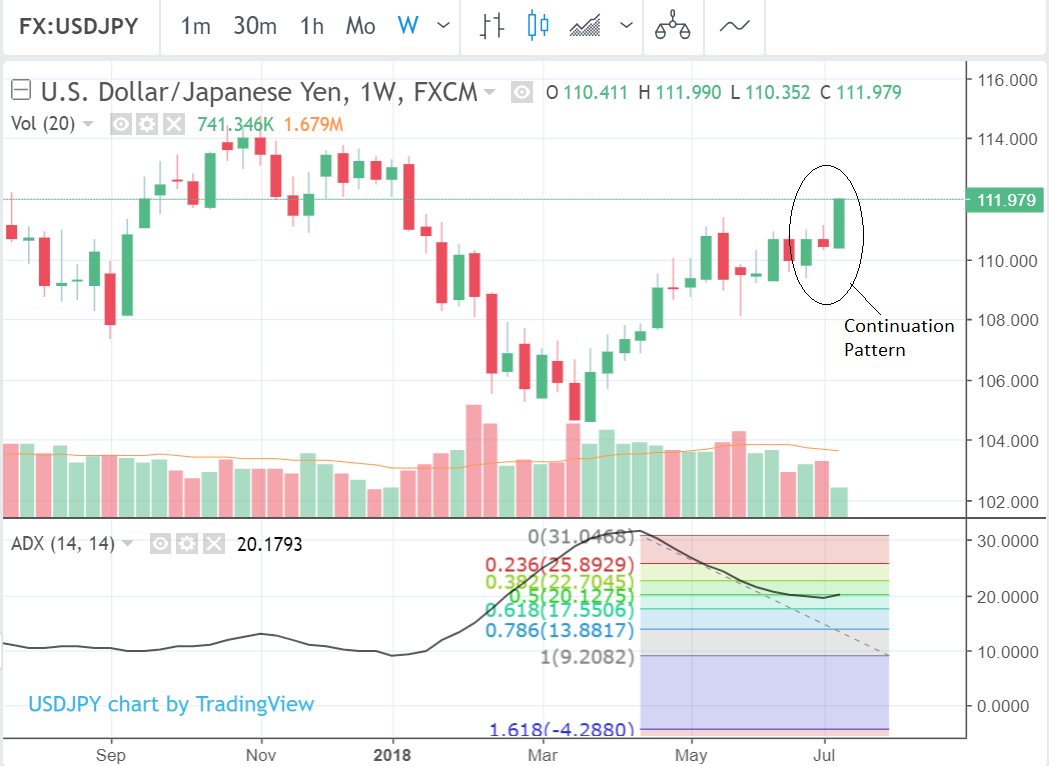
Above: USD/JPY rate shown at weekly intervals.
Again it is not a perfect specimen, as ADX, though sufficiently high, has not been rising for enough weeks to meet all of the criteria for a very high probability set up either. However, the ADX does look more likely to rise from here than not as it has started to turn higher after falling to the midpoint, or 50% level of the previous rally, which is a common turning point for prices and their indicators. But it currently suggests more upside, thus enhancing the continuation signal.
One possible way of avoiding the risk of entering the market at too high a price could be to only buy if the market pulls back. This could either be done on a lower timeframe chart such as the 4 hour or 1 hour if the exchange rate falls into the buy-zone between the 10 and 20 day moving averages and then recovers by forming a reversal for example. Or it could be done by entering at a previously significant market level, such as the 111.50 May highs, where prices will almost probably pull-back to before resuming their uptrend again.
Advertisement
Get up to 5% more foreign exchange by using a specialist provider to get closer to the real market rate and avoid the gaping spreads charged by your bank when providing currency. Learn more here