


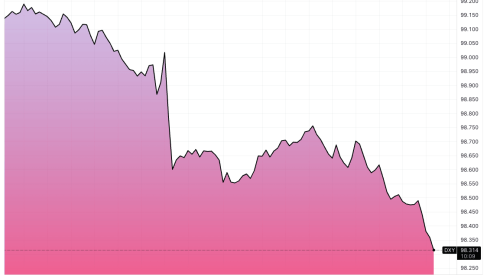
 GBP
GBP EUR
EUR USD
USD AUD
AUD NZD
NZD ZAR
ZAR CAD
CAD CHF
CHF JPY
JPY


EUR/AUD And EUR/NZD: Both are Now in the 'Buy-zone'
-EUR/AUD pulls back into what some call the 'buy-zone'.
-Renewed uptrend conditional on bullish candlestick pattern.
-EUR/NZD is showing signs of carving out a similar pattern.

© Kasto, Adobe Images
EUR/AUD has been in a relatively strong uptrend since the beginning of June but over the last few days the pair has undergone a pull-back.
So far the shallow correction suggests potential for a renewed move higher. In other words, it is probably a period of profit-taking before another leg higher rather than a bearish reversal in the trend.
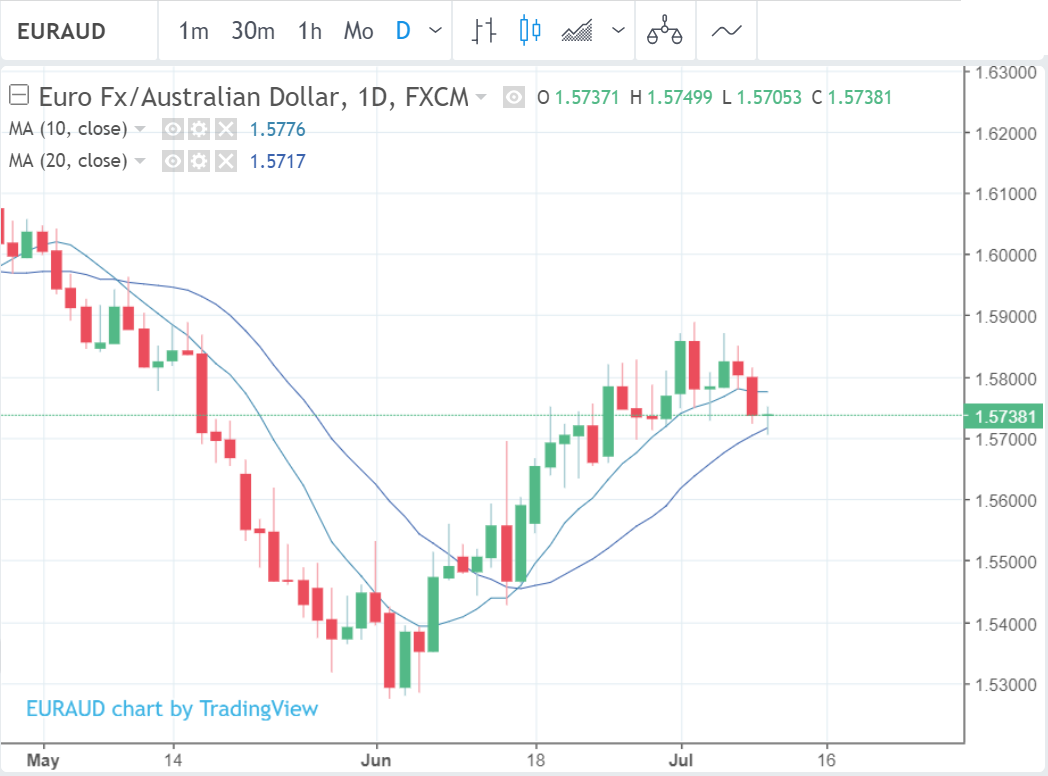
Above: EUR/AUD shown at daily intervals.
What's more, the exchange rate now finds itself in what technical analysts call the 'buy-zone', which is a space between the 10 and 20 day simple moving averages. This is often seen as the perfect place for latecomers to buy into an uptrend.
The formation of a bullish candlestick pattern such as a hammer, bearish engulfing, morning star or other Japanese candlestick reversal in the buy-zone would be a strong signal to buy at the highs, as the market would be expected to move higher.
.png)
Above: Candlestick patterns.
How much higher is difficult to say but the weekly chart (below) offers some useful clues. The March high at 1.6205 is the most compelling target in a rally although the more conservative trader might be more comfortable cashing up at the 1.6000 level given it is a major round-number and, therefore, a place where traders are likely to take profits.
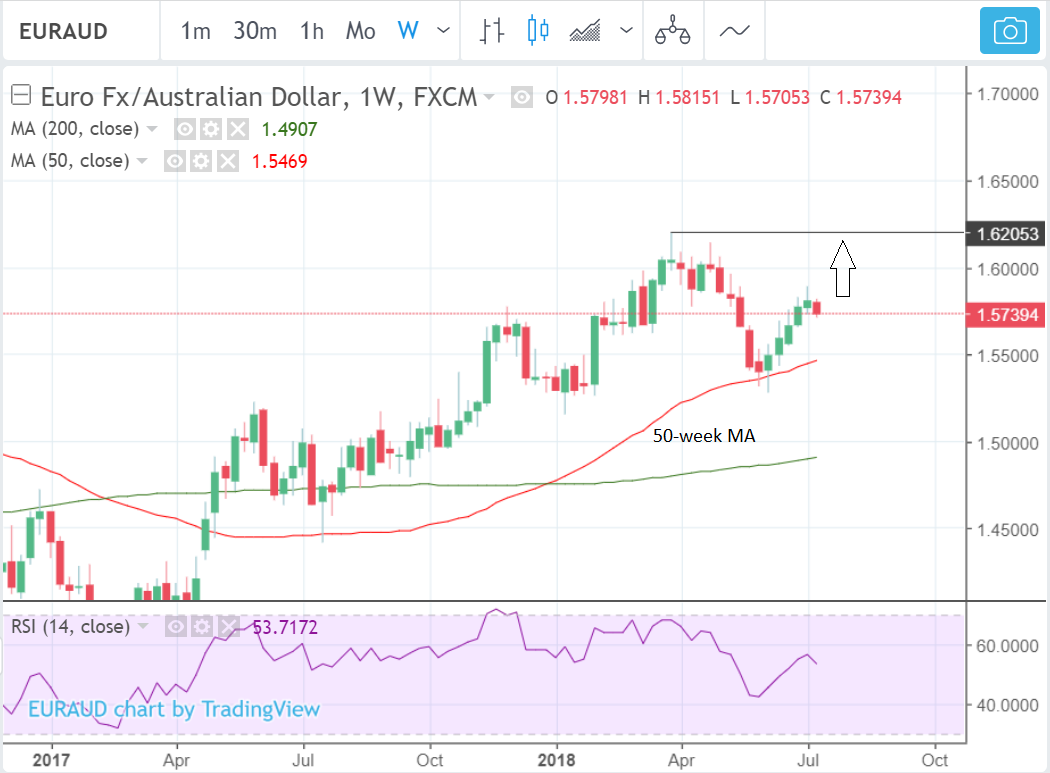
Above: EUR/AUD shown at weekly intervals.
Another Euro pair showing a similar set-up is EUR/NZD. This pair has also rallied quite strongly and then pulled back into the buy-zone between the 10 and 20 moving averages during recent days. Likewise, a bullish reversal candlestick pattern would have to form to signal a continuation higher.

Above:EUR/NZD shown at hourly intervals.
For EUR/NZD a possible end-target might be at the top of the long-term range it has been moving in since November 2017, which is around 1.7489.
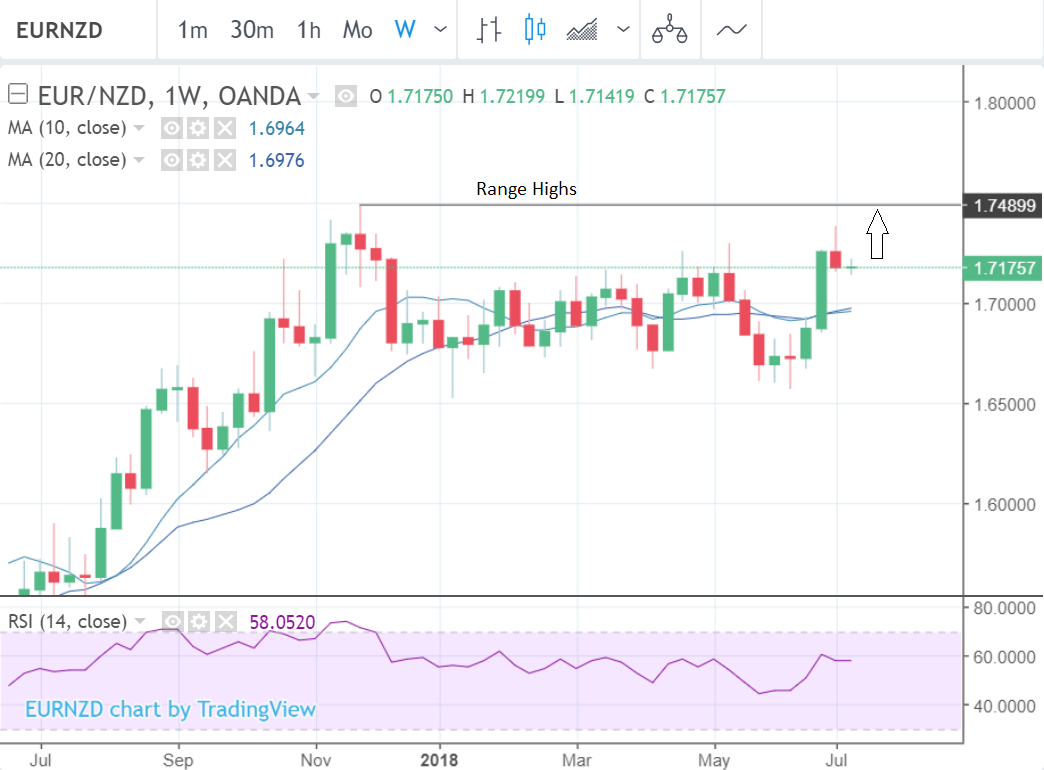
Above: EUR/NZD shown at weekly intervals.
Advertisement
Get up to 5% more foreign exchange by using a specialist provider to get closer to the real market rate and avoid the gaping spreads charged by your bank when providing currency. Learn more here