

Image © Adobe Images
GBP/NZD's August recovery has failed at its long-term average and the decline looks set to resume.
The Pound-to-New Zealand Dollar exchange rate spent the first half of August rebuilding towards the 200-day moving average, was turned away without ever closing above it, and Friday's session took the market beneath the low that recovery began from, closing at the bottom of the day's range.
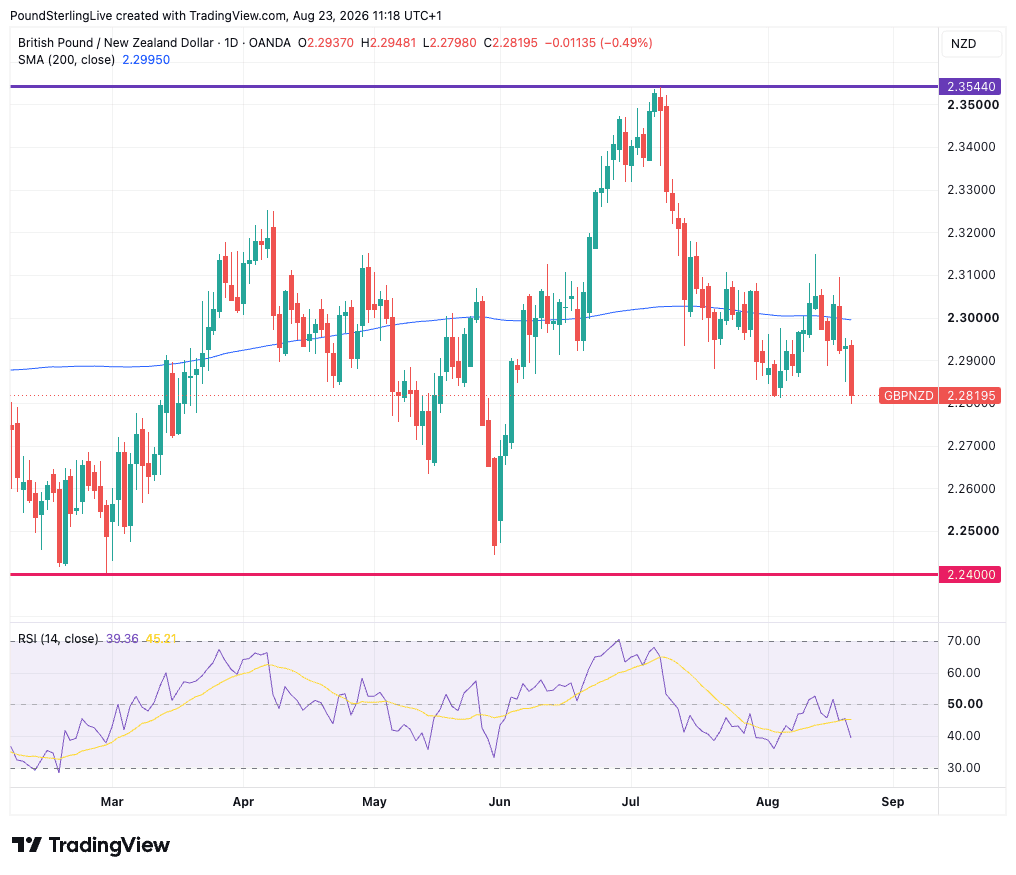
Above: GBP/NZD daily chart. Image © Pound Sterling Live, chart created with TradingView.
A recovery that ends below its own starting point is a resumption rather than a pause, and the market now enters a stretch of chart with almost nothing drawn on it, which is the condition in which declines travel furthest.
From a tactical perspective, the Pound's task is defensive and it faces the week without help, because the New Zealand calendar is thin, the UK calendar is close to empty, and the dominant input is the direction of the U.S. Dollar through Wednesday's inflation report and Friday's Jackson Hole speech.
The pair closed the previous week at 2.28195, that is the lowest close since the start of July and it sits 1.75 cents beneath the 200-day moving average at 2.29950.
The 200-day flattened through the summer and has now begun to roll over, and it has done its work twice this month, capping the mid-August recovery near 2.3080 and turning the market back again last week.
The RSI reads 39.36 against a signal line at 45.21, with the faster line beneath the slower and falling, and 39 leaves considerable room before any oversold reading would argue for a bounce.
Friday's close came at the low of the day, which is the pattern of a market still carrying sellers into the close rather than one finding a base.
Resistance now begins at the early-August low near 2.2860, a level just broken and which converts to resistance on that basis, then the 200-day at 2.29950, then the July peak at 2.35440.
Support is the problem for those hoping for a firmer GBP/NZD: the next horizontal on the daily chart is 2.24000, more than four cents beneath spot, with the June low just above it and nothing in between.
Our Pound-to-New Zealand Dollar forecast is for the decline to extend towards 2.2600 and then the 2.24000 area over the coming week, with a daily close back above the 200-day at 2.29950 the development required to argue the August recovery has any life left in it.

The Bank Consensus, Without the Terminal
The median, mean, highest and lowest from the October survey update, plus named point forecasts out to 2027.
Free information pack, issued by World Wide Currencies.
The medium-term picture stays bearish while the 200-day caps the market, and July's advance to 2.35440 now reads as a spike inside a range rather than a breakout from one, because every cent of it has been given back.
Retail Sales and Jobs Frame the RBNZ's 2 September Decision
New Zealand's calendar is thin and every release is read through the Reserve Bank's Monetary Policy Statement on 2 September.
Q2 retail trade opens the week overnight on Sunday, with Westpac forecasting a 1.1% rise in nominal spending against a 0.2% fall in volumes, and core spending expected firmer at 0.6%.
The July monthly employment indicator follows on Friday, where the same bank has pencilled in a 0.3% rise after 0.1% in June.
Market pricing is firmly in favour of another official cash rate hike next month, says Michael Gordon, senior economist at Westpac, with far more uncertainty around what the Reserve Bank signals for the remaining meetings this year.
The Auckland-based team publishes its quarterly Economic Overview on Wednesday, carrying its updated call on the cash rate track.
Neither release will shift the September hike betting stakes, which is why the data does not lead this article.
To be sure, the rate support has softened at the margin, and that governs how far this decline can run.
In this context, July's selected prices release was softer than expected, with food price growth slowing to an eighteen-month low of 1.9% and housing rents falling a further 0.1%, which points to downside risk to Westpac's forecast of a 0.7% rise in Q3 consumer prices, an outcome that would slow annual inflation from 4.1% to 3.7%.
The Reserve Bank's household survey showed the median one-year inflation expectation down 0.5 percentage points to 4.5% and the two-year measure down 0.6 points to 3.4%, results that at the margin might ease concerns about second-round effects, according to Darren Gibbs, senior economist at Westpac.
Inflation is still expected to sit well above the Reserve Bank's target band for the remainder of the year, including firm core readings, so the direction of travel on expectations is dovish while the level remains hawkish, and it is the level the September decision responds to.
Why Does a Falling Dollar Push This Cross Lower?
The more important driver for GBP/NZD in the coming week will almost certainly be the U.S. dollar, which has come under pressure of late.
GBP/NZD has struggled as the dollar has fallen, because GBP/USD has lagged NZD/USD during the dollar's stretch of weakness: NZD has a higher beta to USD weakness.
The Kiwi wins that contest consistently, owing to its commodity linkages, its sensitivity to global risk appetite and its relative illiquidity, while the Pound's response is diluted by gilt yields, Bank of England expectations and domestic politics.
This is why Wednesday's US personal consumption expenditures report and Friday's Jackson Hole speech from Federal Reserve Chair Kevin Warsh are the week's principal events for a currency pair containing no American exposure at all.
Any USD weakness in wake of these events could well see GBP/NZD come under further pressure.
The Bank Consensus, Without the Terminal
The median, mean, highest and lowest from the October survey update, plus named point forecasts out to 2027.
Free information pack, issued by World Wide Currencies.