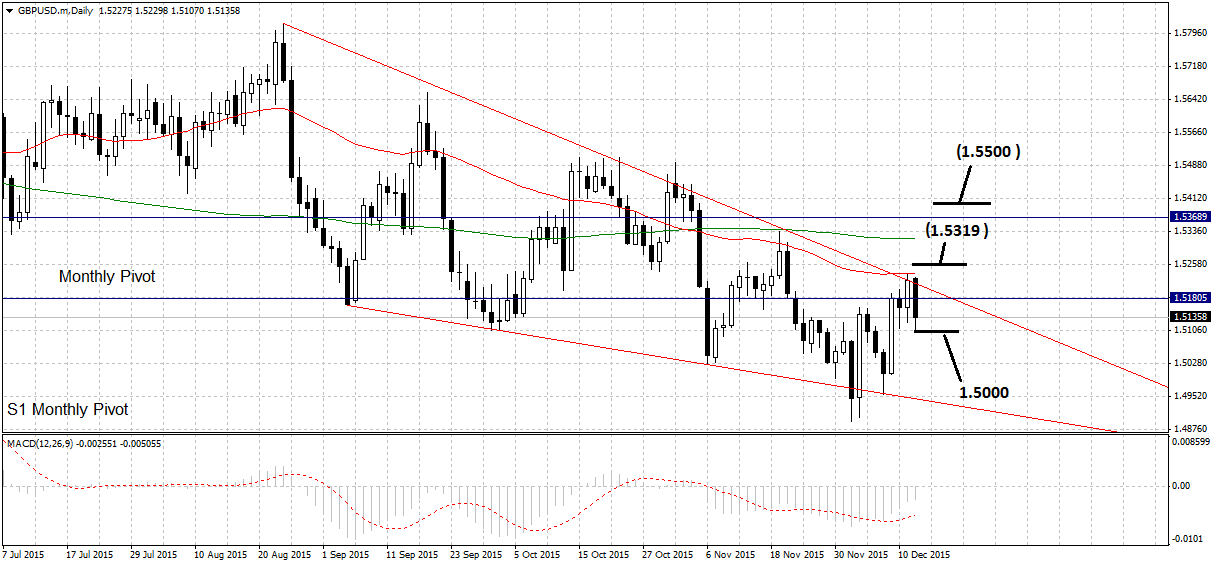
The pound to dollar exchange rate has met resistance from a cluster of levels, including the 50-day MA, at the upper border of a falling wedge pattern on the daily chart, which could lead to a move back down.

The loaction of many strata of resistance levels above price’s current level combined with the fact the wedge appears unfinished indicates the likelihood, on balance, of the next move unfolding back down inside the wedge, signalled by a break below 1.5085, and then lower to the underside border at around the 1.5000 mark – or possibly even 1.4950.
Falling wedge’s often lead to volatile breakouts higher and eventually I see the pair breaking higher once the pattern matures.
The presence of the 50-day, 200-day and monthly pivot so close to present levels, however, means that such a bullish pattern break out now - unless as a result of a market shock- would be at risk of quickly hitting a wall of selling, putting it at risk of quickly losing momentum.
As such a breakout from the current trading level would, ideally, need to clear all of these levels, however, a move above the 50-day MA confirmed by a break above 1.5260, would probably reach the 200-day initially, at 1.5319.
For more confidence look for a break above 1.5400, in order to safely confirm further upside, to a possible target at the 1.5500.