

Image © Adobe Stock
The British pound looks set to extend its recovery against the New Zealand dollar in the days ahead, but the market isn't ready to trend meaningfully.
The pound-to-New Zealand dollar exchange rate has climbed back above the 100-day moving average it spent August beneath, thanks in part to the Kiwi being the G10's laggard since the Reserve Bank of New Zealand paired last week's rate rise with a projection the market read as dovish.
GBP/NZD trades at 2.3145 on Tuesday, up 0.47%, having crossed a 100-day moving average at 2.3005 that has gone sideways since July.
The 100-day is flat and is likely working as a pivot, suggesting the rebound is a swing inside a range:
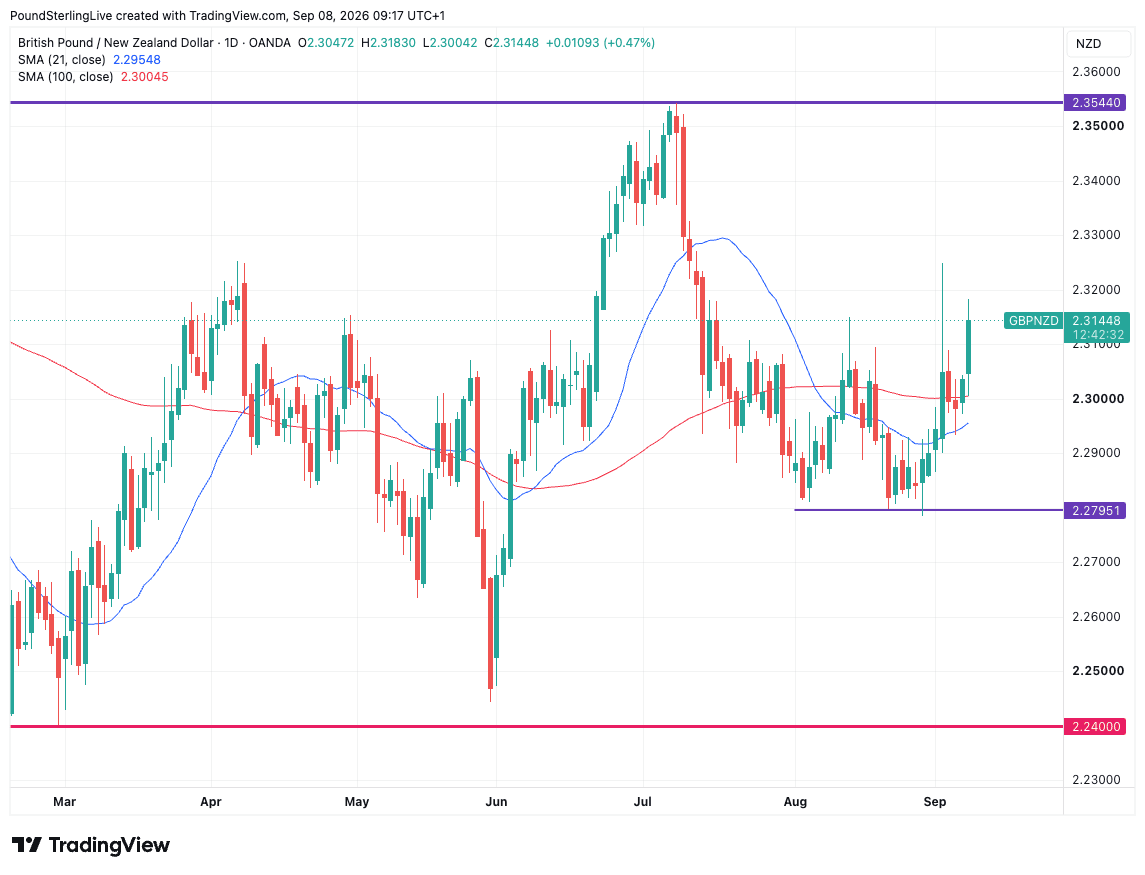
Above: GBP/NZD daily chart. Image © Pound Sterling Live, chart created with TradingView.
The 21-day moving average at 2.2955 turned higher at the start of September after falling since the middle of July, and it still sits beneath the 100-day with price above both. A cross of the 21-day up through the 100-day is the confirmation this chart has not yet produced, and it would be what separates a swing from a turn.
Mid-August delivered a rally that cleared the same average and reached roughly 2.3080 before the sellers took it all back to the 2.2795 shelf by the start of September; classic price action around a pivot anchor.
The limits to the swing to the downside looks to be the 2.2795 graphical horizontal support as it has now caught two declines, which establishes it as the floor of the range.
To the upside, nothing is drawn on the chart between Tuesday's high at 2.3183 and the 2.3544 peak from July, and that is the top of the range the flat average sits in the middle of. It is too far above the market to be reached by a swing of this size.
Recovery Can Extend
A week ago we looked for the break to come higher, through the 21-day at 2.2917 and towards 2.2985, which we expected to cap the move.
The break came and the cap did not hold, with the market clearing 2.2985 and running to 2.3183 on Tuesday.
For now we look for the recovery to extend while the market holds above the 100-day at 2.3005. A daily close back beneath the average returns this to the August pattern, and our Pound to New Zealand Dollar forecast only turns clearly constructive once the 21-day crosses above the 100-day.
The RBNZ's Own Rate Track Has Left the Kiwi the G10 Laggard
The most recent GBP/NZD gains reflect a broader underperformance in the NZD complex.
"Likely weighed by last week's dovish hike by the RBNZ, the NZD has been one of the laggards in the G10, falling to fresh 13-year lows against the AUD last night (0.8134). There were also modest falls in the USD index. The NZD traded in a 0.5870 to 0.5970 USD range overnight," says ASB.
The market went into that RBNZ hike meeting with the increase fully priced, which left the projections carrying the risk, and that is where it landed.
How does a rate track move a currency? A central bank that raises rates while publishing a path implying little further tightening tells the market the cycle is nearly finished, which caps the yield available on that country's bonds and takes away the reason to hold its currency. A track pointing higher does the reverse and lifts it.
The 13-year low against the Australian dollar is the clearest reading of it, because the Reserve Bank of Australia is being priced for a hike as soon as this month while the RBNZ has just told the market it is close to done. That divergence is why the pound is falling against the Aussie and rising against the Kiwi in the same week.
Our Pound-to-New Zealand Dollar forecast leans on that divergence holding. The chart has given a constructive swing and withheld confirmation, and it is the rate story that decides which of those the coming days settle on.

The Bank Consensus, Without the Terminal
The median, mean, highest and lowest from the October survey update, plus named point forecasts out to 2027.
Free information pack, issued by World Wide Currencies.