The Pound to Dollar exchange rate (GBP/USD) has fallen for two straight days in a row, the question is, is this just a temporary setback or the start of a new downtrend?
The British Pound has weakened from its December highs, propelled by poor manufacturing data and a sudden surge in global stockmarkets which have brought UK Gilt yields sharply lower.
It was the impressive rally in UK Gily yields following the victory of Donald Trump in early November that was the prime driver of the Sterling recovery.
That there have been no negative headlines concerning Brexit in the interim has also certainly helped.
There is also the sense that with Brexit news playing less of an influence markets are also taking more cues from the technical setup of the market.
Lloyds Commercial Banking’s Adam Wilkin notes that GBP/USD was this week nearing a tough resistance zone between 1.2800 and 1.3000, and was, therefore likely to struggle.
And struggle it has.
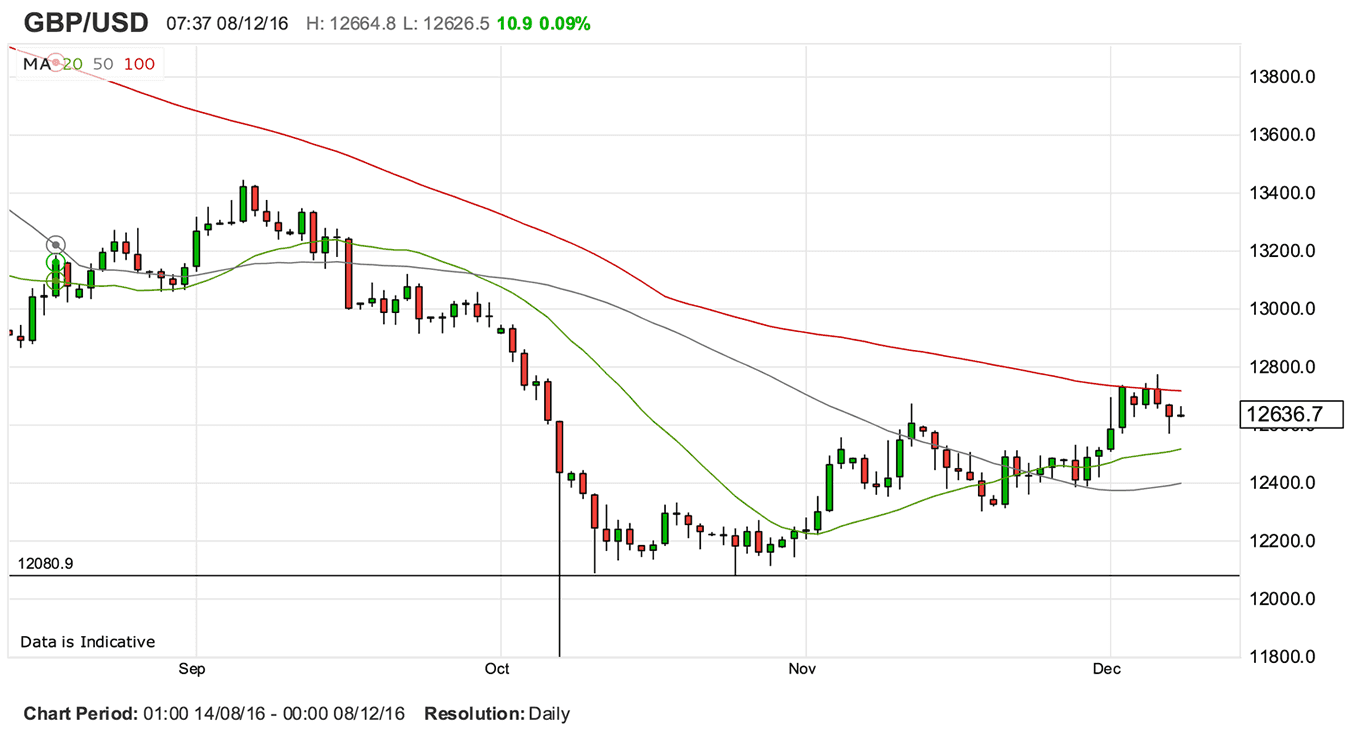
The exchange rate rose up to the 100 day moving average that was located towards 1.28 and found strong supply at this level forcing it into retreat.
Hantec Market's Richard Perry was less bearish in his views suggesting Sterling bulls may "just have lost their way for a moment."
Overall it seems too soon to say whether or not we will go lower.
Nevertheless, one major longer-term target could now have been met, suggetsing the possibility GBP/USD may be forming a major top.
Latest Pound / US Dollar Exchange Rates
  | Live: 1.3478▼ -0.01%12 Month Best:1.3867 |
*Your Bank's Retail Rate
| 1.302 - 1.3073 |
**Independent Specialist | 1.3289 - 1.3343 Find out why this is a better rate |
* Bank rates according to latest IMTI data.
** RationalFX dealing desk quotation.
Is an Eliot Wave in Control?
Back in late October, not long after the flash crash lows, technical analysts at JP Morgan made a bold forecast.
Using Elliot Wave theory, a form of cycle analysis, they predicted that the pair would recover in a large wave 4 (the exchange rate was at 1.21-22 then) which would end in a zone between 1.2600 and 1.2850.
According to the theory this would then be followed by a strong wave 5 back down to at least as low as the flash crash lows.
We are now plum in the centre of that zone, so if prices are going to start moving lower, now would be the perfect time.
J P Morgan’s analysis would seem to indicate that the pair will go lower eventually, with a high probability of retesting the 1.1450 lows.
By when, however, is a different question altogether and not so easy to answer.
Wave 4’s can be long drawn out complex affairs and we have no way of knowing whether we are at the start of a more complex wave 4 or the beginning of wave 5 back down to the lows.
One hint may come from looking at wave 2 as wave 2s and 4s tend to alternate in duration or form.
On GBP/USD wave 2 was not complex but it was 10 weeks long.
This suggetss wave 4 will be complex and last longer.
It is currently only 8 weeks long, which seems to indicate it has longer to run.
If so a strong wave 5 downmove may not be about to start, however, the pair may still have formed an important top nevertheless.
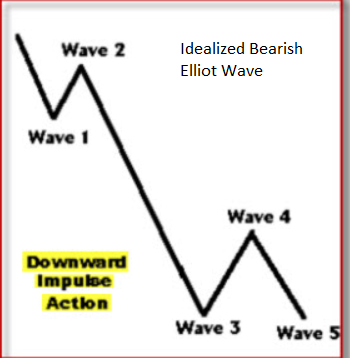
An idealized Elliot wave pattern
Lloyds’ Compelling Momentum Study
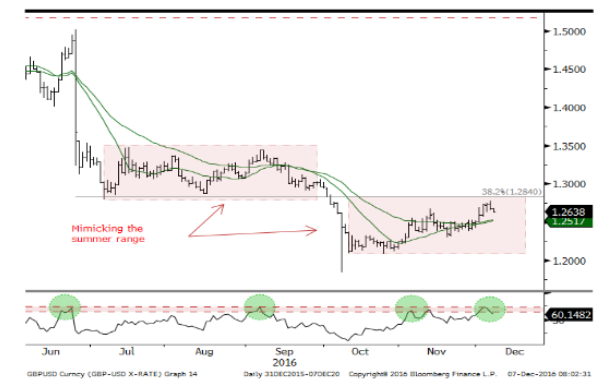
Lloyds have compelling technical evidence that that pair may be about to make a major turn lower.
They show how historically the GBP/USD exchange rate has always turned lower when momentum studies have turned in a certain place (shown as green circles on the chart).
This suggests compelling evidence for the pair beginning a major move lower.
Two’s not enough: You need Three
Whilst we have had two down days in a row, that's not enough - ideally we need three.
The power of three does not just relate to the art of rhetoric but also to technical analysis of price charts.
One need only go back to the work of the great trader W.D Gann to see the first mention of how three up or down days have a special significance in the market and form part of the basis of his pivot swing strategy.
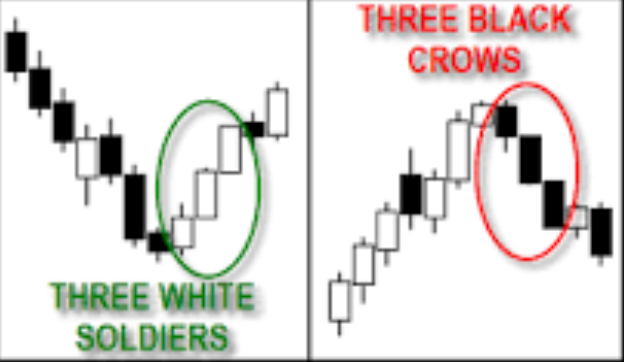
Japanese candlesticks also celebrate the power of three direction days in the form of the bullish ‘three white soldiers' pattern, which is made up of three white bars in a row after a major bottom and ‘three black crows’ made up of three down days in a row from a top.
So, although we have had two down days in a row from the 1.2775 peak, ideally technical analysts would want to see a third down day to be more confident about calling a top.
This may make Thursday, December 8 a particularly important day for GBP/USD.