The South African rand has fallen alongside other major commodity-linked currencies thanks to surprisingly weak data out of China today, but expect weakness to be short-lived.
- Pound to rand exchange rate weaker at 21.8327 but charts giving off mixed signals concerning outlook
- Watch mining and gold production numbers due later this week
The South African rand has joined its commodity currency cousins and is lower following poor Chinese data released on Tuesday.
Data showed China’s Trade Balance for February read at 32.59 BN USD, well below consensus forecasts for 50.15 BN USD and almost half the 63.29 BN reported in January.
Exports fell 25.4 percent on-year, double the amount analysts had forecast the decline to read.
"That shocking slide in exports was joined by at similarly weak, if not quite as alarming, 13.8% drop in imports; combine the two together and it is the kind of ugly reminder of China’s spluttering economy investors certainly don’t need at the moment," says Connor Campbell at Spreadex.
This has impacted sentiment towards the rand, which derives much of its value from the export of materials from South African mines to China.
That said, the commodity story is not over and taking too downbeat-a-tone on tZAR could prove premature at this stage.
Latest Pound / SA Rand Exchange Rates
  | Live: 22.0212▲ + 0.09%12 Month Best:24.6167 |
*Your Bank's Retail Rate
| 21.2724 - 21.3605 |
**Independent Specialist | 21.7129 - 21.8009 Find out why this is a better rate |
* Bank rates according to latest IMTI data.
** RationalFX dealing desk quotation.
The underlying tone on commodities is certainly improved with expectations of substantial easing from the Peoples Bank of China (Pboc) improving market sentiment and commodity prices - both factors which favour a stronger rand.
Oil surged 6% at the start of the week, but this was outshone by a whopping 20% rally in iron ore prices.
Watch Thursday's Mining Production Data
Nevertheless, there are further risks on the commodity front with domestic gold and mining production numbers due out on Thursday.
“Mining and manufacturing production is likely to continue to show weakness, with the possibility of negating any rand gains later in the week. On balance, expect rand gains early in the week and weakening towards the end of the week, with wide ranges as we approach the ECB decision on Thursday,” says John Cairns at RMB in Sandton, Johannesburg.
Markets are forecasting gold production to have slumped -3.1% in the year to January. Mining production is forecast to have risen 0.1%. Should the actual numbers be worse we could see ZAR shift lower yet.
The rand does however retain a mildly bullish tone at the present time having enjoyed a few weeks of strength.
At the end of 2015 the rand weakened in a volatile spike after political in-fighting led to two Finance Ministers being fired in quick succession and a massive loss of confidence in the government’s ability to manage the economy.
Markets have calmed and the rand recovered in the new year following a short period of stability, however, there are still concerns about underlying risks after a recent stand-off between current Finmin Gordhan and one of President Zuma’s allies threatened once again to lead to a job opening at the top spot of the Finance ministry, however, this now appears to have blown over.
GBP to ZAR Chart Forecasts
GBP/ZAR is in a sideways consolidation with highs at 22.3600 and lows at 21.2000. It is giving off mixed signals.
The pair has fallen in a broadly three wave pattern from off the January highs, and the short-term trend is bearish.
However, after recovering on the 24th of February at 21.2079 it formed three up day’s in a row, which is a bullish sign indicating the probabilities favour a break above the 22.68 highs of February 26 eventually.
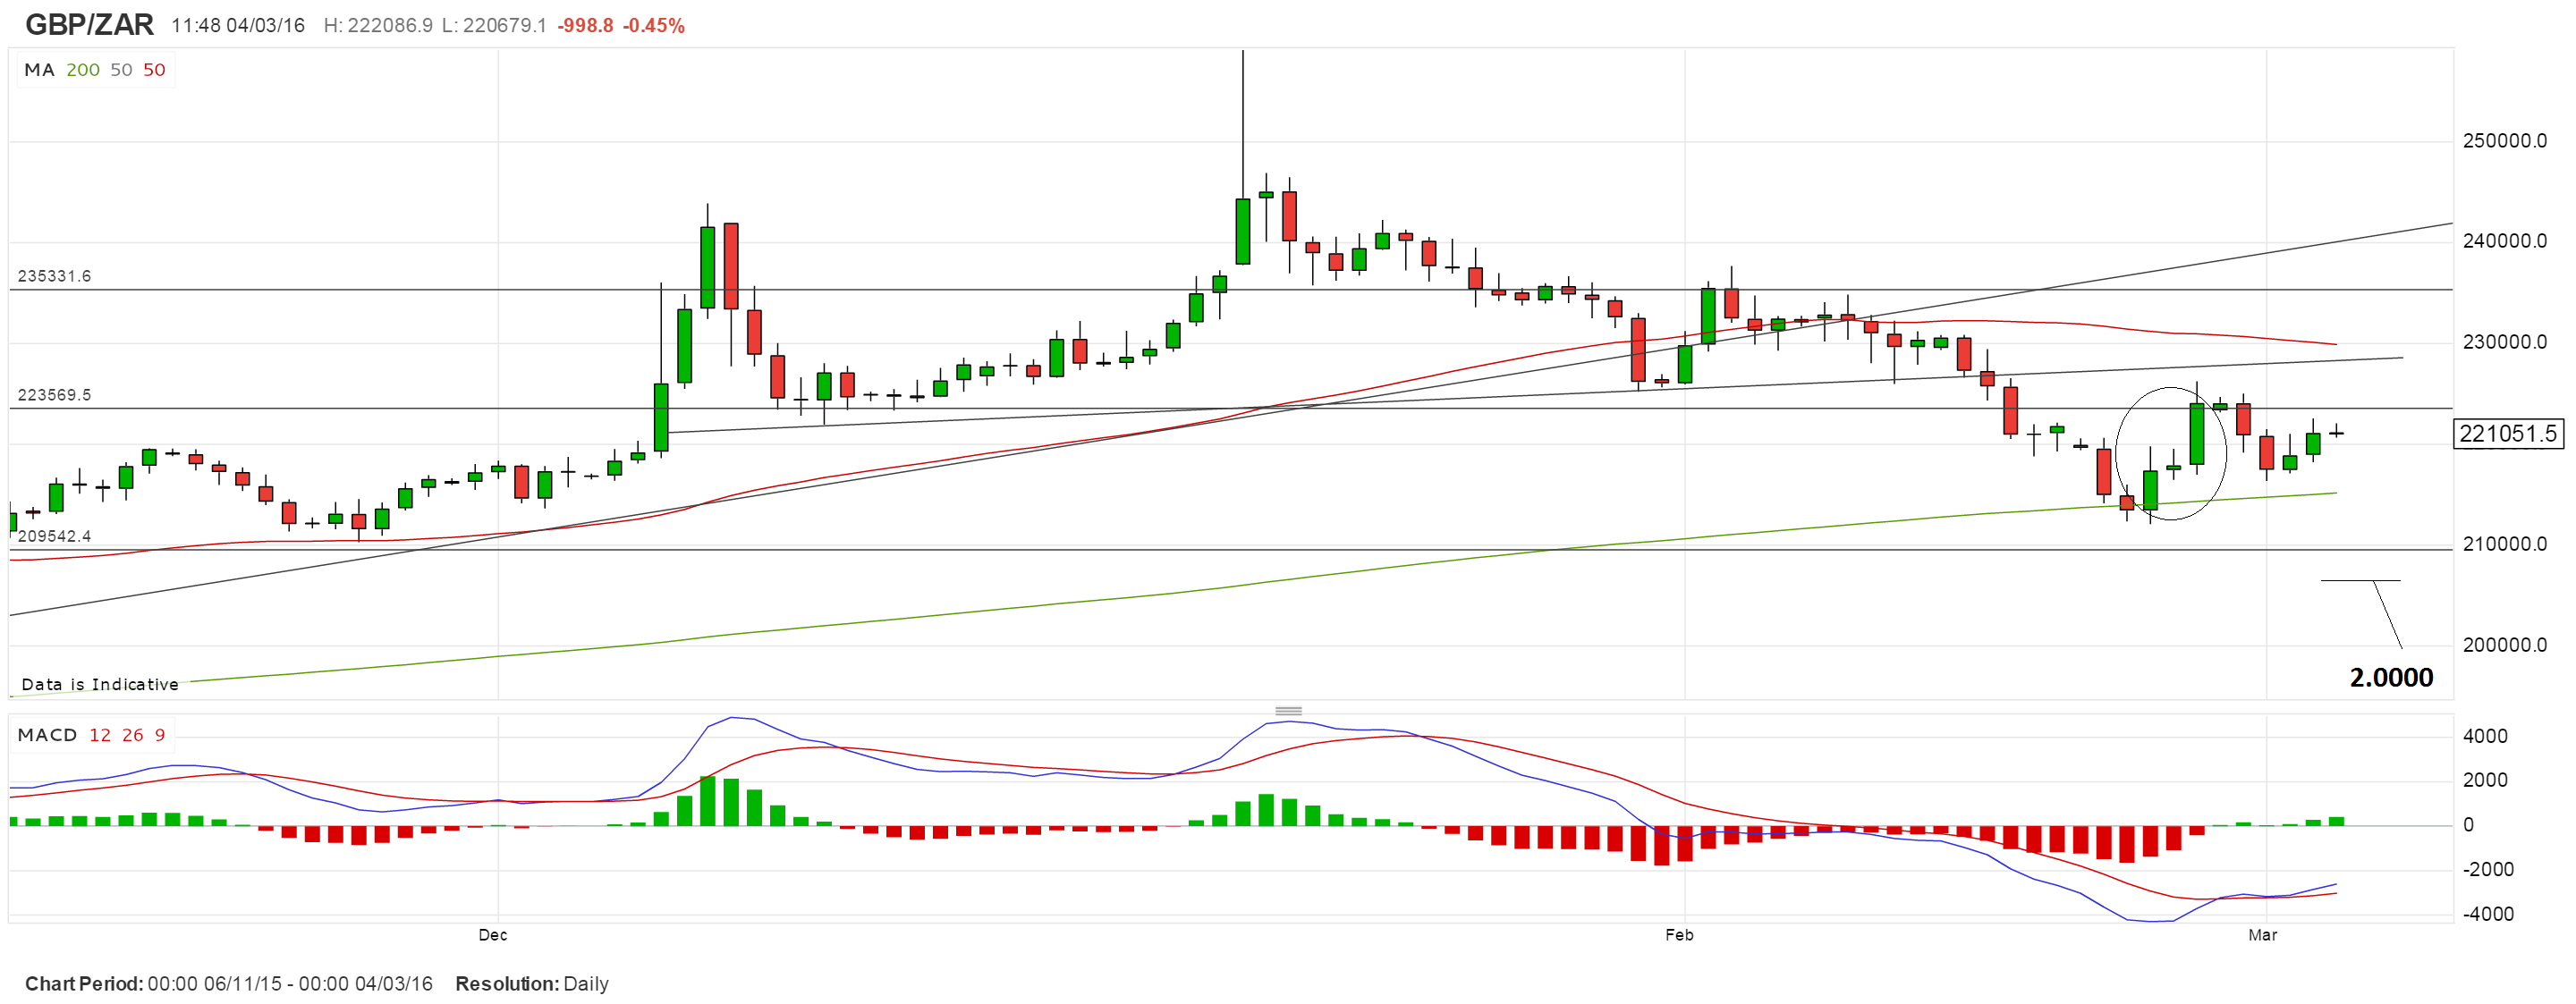
A cluster of formidable resistance levels in the 22s including the old neckline of a head and shoulders topping pattern and the 50-day MA at roughly 23.0000, are limiting upside.
By the same token downside is also limited by the 200-day MA and the S1 Monthly Pivot at 20.9542.
Therefore, a clear break below 20.8000 would be required to confirm a continuation of the fledgling down-trend down to a target at the psychologically significant 20.0000 mark.
Nevertheless, increasingly bullish momentum, as indicated by the rising MACD indicator in the bottom pane, adds an offsetting factor to the chart.