
Image © kasto, Adobe Stock
- High probability 3-bar pattern sets-up and pints to further declines
- Other indicators from otpions market and positioning suggest further downside
- BUT other indicators warn Sterling may be oversold
The GBP/USD exchange rate is quoted at 1.2833 at the time of writing; not far off the monthly and 2018 low located at 1.2825.
We noted earlier this week how the Pound-to-Dollar exchange rate has formed a high probability set-up which suggests a deeper decline is in store for the pair - and over the past 24 hours we have note how the exchange rate has formed another identical set-up immediately after the first which also suggests more downside.
The pattern coincides with continued fears of a 'no-deal' Brexit triggered by reports prime minister May is stepping up preparations in case of a no-deal scenario.
The prime minister has now sceduled a top-level meeting of her cabinet ministers early in September specifically to discuss how to ready the U.K. for a no-deal Brexit, according to a Bloomberg report released overnight.
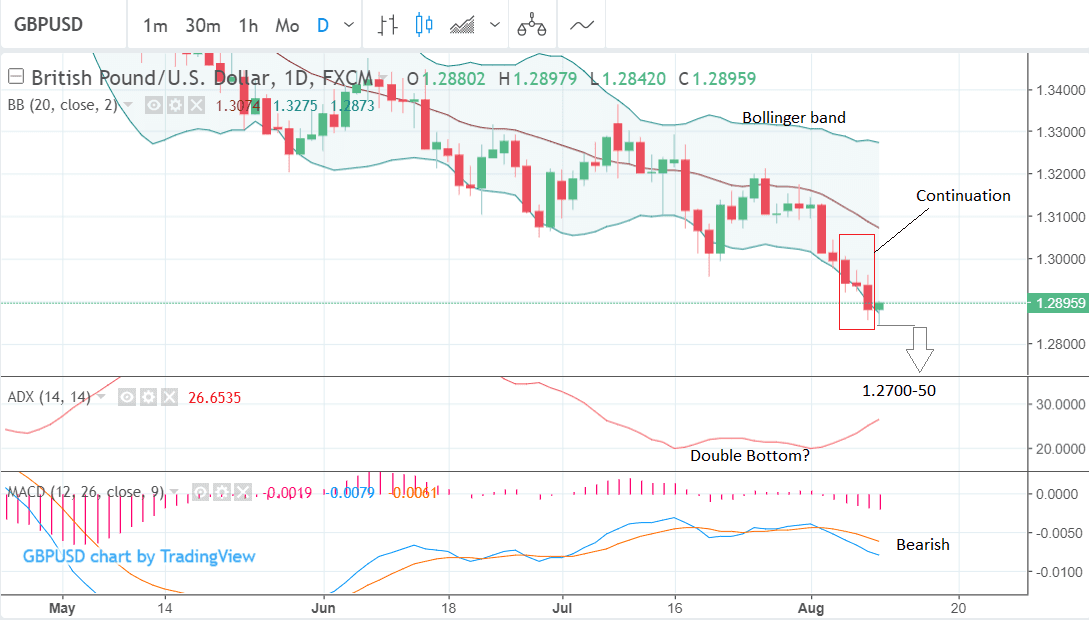
Meanwhile from a technical perspective, the GBP/USD pair, which is in an established downtrend, has formed another three bar continuation pattern (bordered in red below), which combined with a rising ADX indicator in the lower pane produces a high-probability - circa 80% - signal of a continuation of the downtrend.
The signal is enhanced by the fact the pair is in a concerted downtrend, and by the fact the ADX indicator in the lower pane is rising.
Indeed it has also formed a double-bottom chart pattern itself which heralds a reversal in the trend, and, therefore, more upside to come as the new uptrend in ADX extends.
ADX measures how strongly prices are trending directionally regardless of the actual direction. The higher it is, the more strongly prices are trending. The optimum point for traders wishing to catch a trend is when ADX is between 20-40; it is currently at 26.63.
The MACD momentum indicator is also looking bearish as it falls steeply from recent highs. The look and feel of the MACD suggests it will continue lower, which enhances the bearish signal for the underlying asset.
The three-bar pattern is made up of a long down bar followed by a very short-bodied bar and a further long down-bar.
How low will the market go? The previous three bar suggested a continuation down to a target which was between 100 and 150 points lower, depending on how conservative you want to be, but this meant around the 1.2770 to 1.2800 zone.
The current set-up has formed at a lower level and suggests a new downside target of between 1.2705 - 1.2755.
A break below the current day's 1.2842 lows would provide confirmation of a continuation down to the target.
Advertisement
Get up to 5% more foreign exchange for international payments by using a specialist provider to get closer to the real market rate and avoid the gaping spreads charged by your bank when providing currency. Learn more here
GBP/USD Oversold?
The extent of the downtrend, however, is now looking oversold according to some analysts, who warn the move could stall and even reverse - with the proviso gains may be capped.
"There are near-term risks of a recovery due the near-term oversold market," says Martin Miller, a correspondent for Thomson Reuters. "But gains will likely to limited by Wednesday/Tuesday 1.2960/73 highs."
The pair has just fallen to touch the lower Bollinger Band, a line situated at 2 standard deviations from the 20-day moving average. This too is a sign a market is potentially oversold. The lower Bollinger is often the location for rebounds and reversals back towards the 20-day and this urges caution in continuing to short the pair.
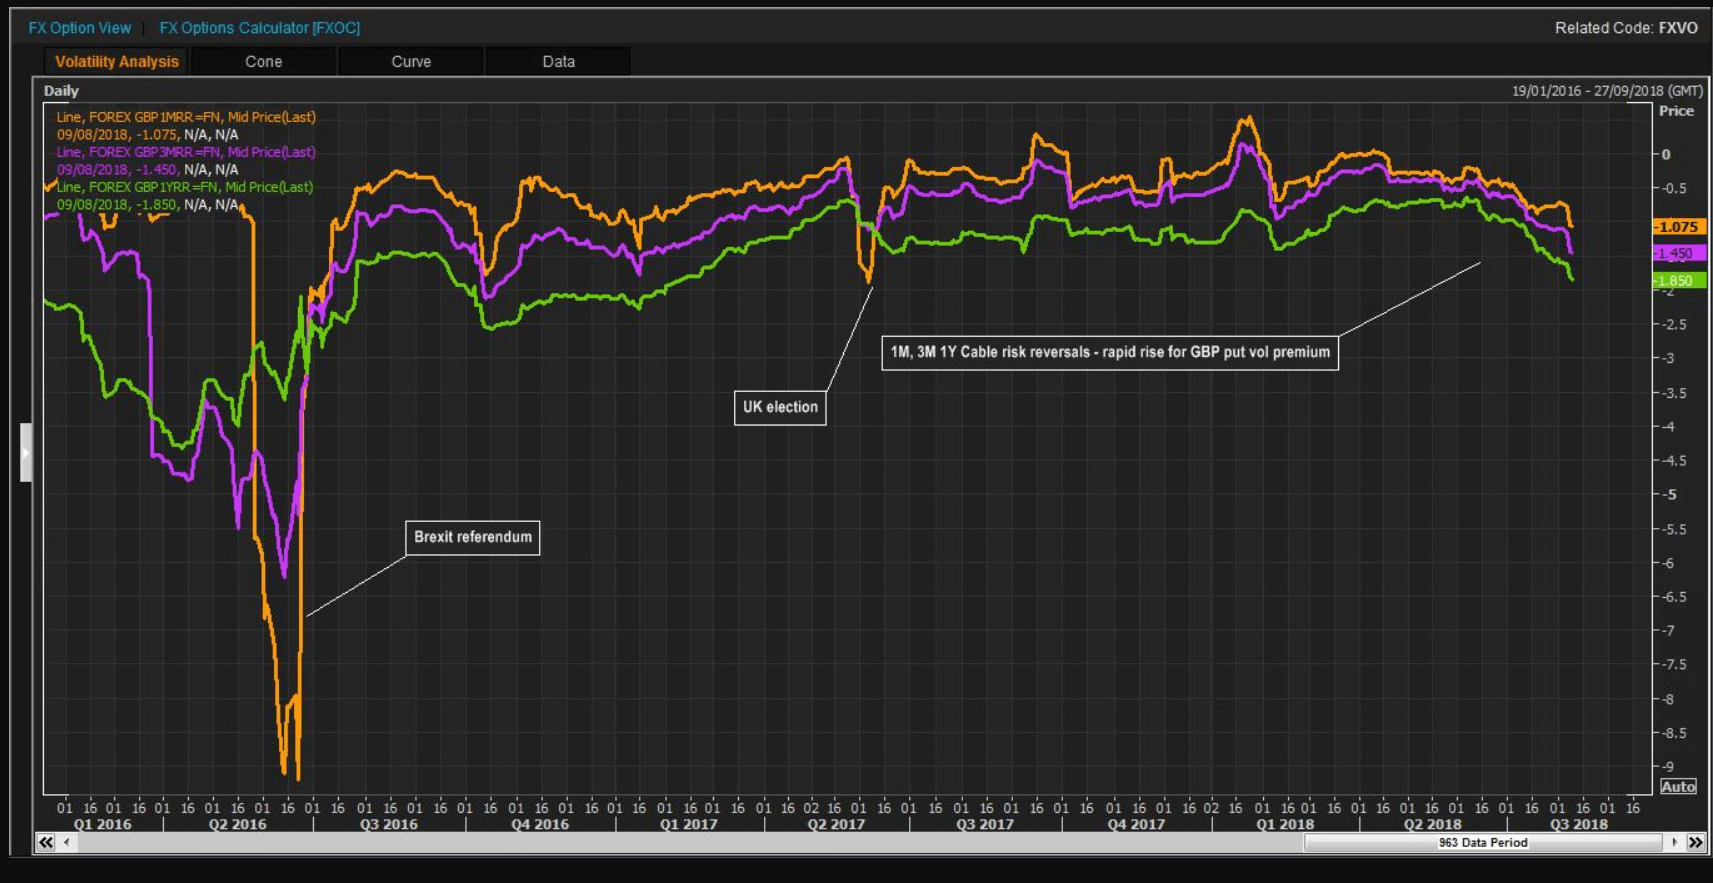
Option Markets Bearish
Yet regardless of concerns the pair may be ovrsold the option market it still bearishly positioned according to Reuters.
"Options flows were targetting 1.25s since Monday...Big demand/gains for option vols and GBP puts - new highs since UK election," says Richard Pace, an analyst with Thomson Reuters
The chart below shows that the premium investors pay for a risk reversal is moveing to levels not seen since the UK election and the referendum vote, which suggests risks for GBP-downside remain.
Positioning Bearish
Retail traders are also showing bearish positioning, according to real-time data from broker Dailyfx.com, which has a table showing current positioning of its traders.
The data is interpreted in a contrarian way so when most retail traders are bullish the pair is actually likely to go in the opposite direction and fall.
In the case of GBP/USD, currently 74% of traders are bullish vs 26% who are bearish which suggests a downside bias for the pair and a continuation of the downtrend.
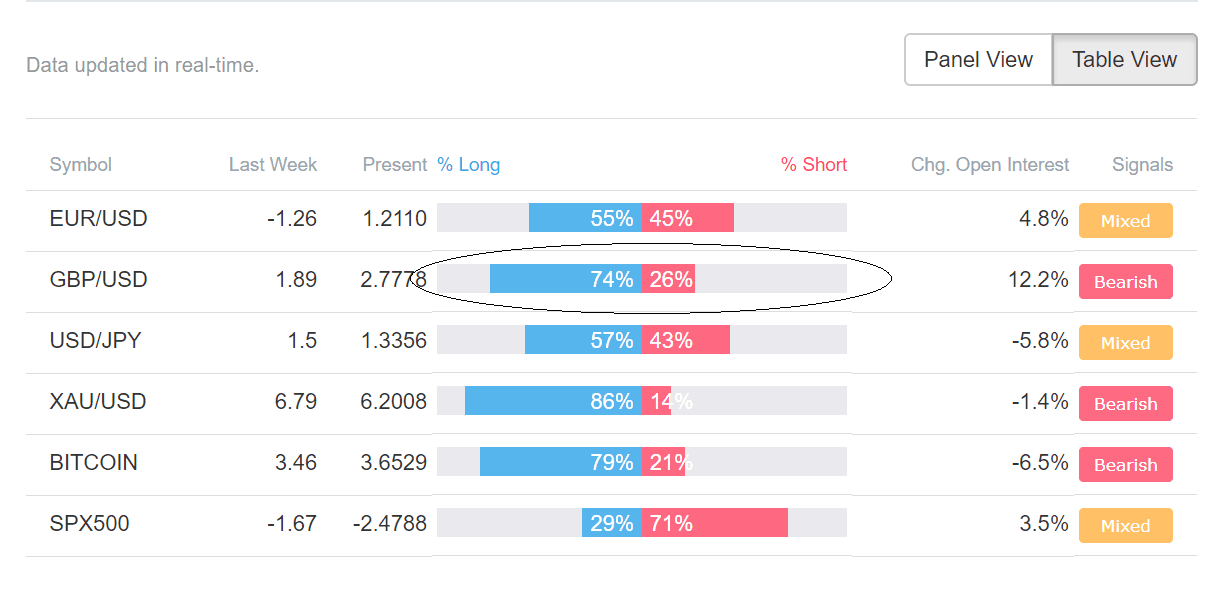
"We typically take a contrarian view to crowd sentiment, and the fact traders are net-long suggests GBPUSD prices may continue to fall. Traders are further net-long than yesterday and last week, and the combination of current sentiment and recent changes gives us a stronger GBPUSD-bearish contrarian trading bias," says Yayati Tanwar, an analyst for DailyFX.
Elliot Waves Also Bearish
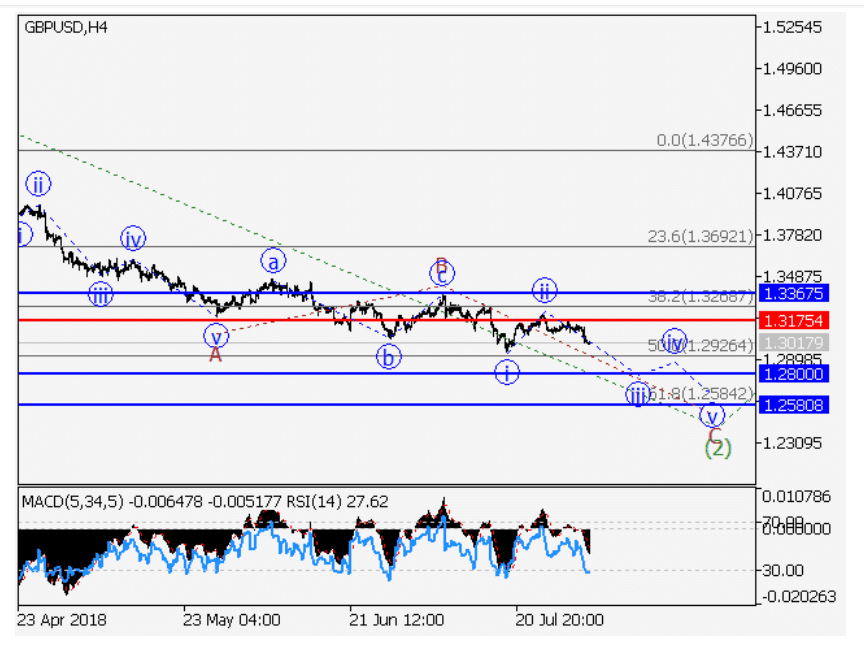
A powerful type of cycle analysis called Elliot Wave analysis further argues for a move down to a broad target between 1.2800 and 1.2580, according to Alex Geuta, an analyst who specialises in Elliot wave at FX broker Instaforex.
The GBP/USD pair is in the third and final wave of an ABC correction of a lomger-term uptrend. the ABC correction began at the 1.43 highs. It is likely to fall further as it completes the final C wave. After wave C finishes, however, it is likely to start going higher again as the longer-term wave resumes.
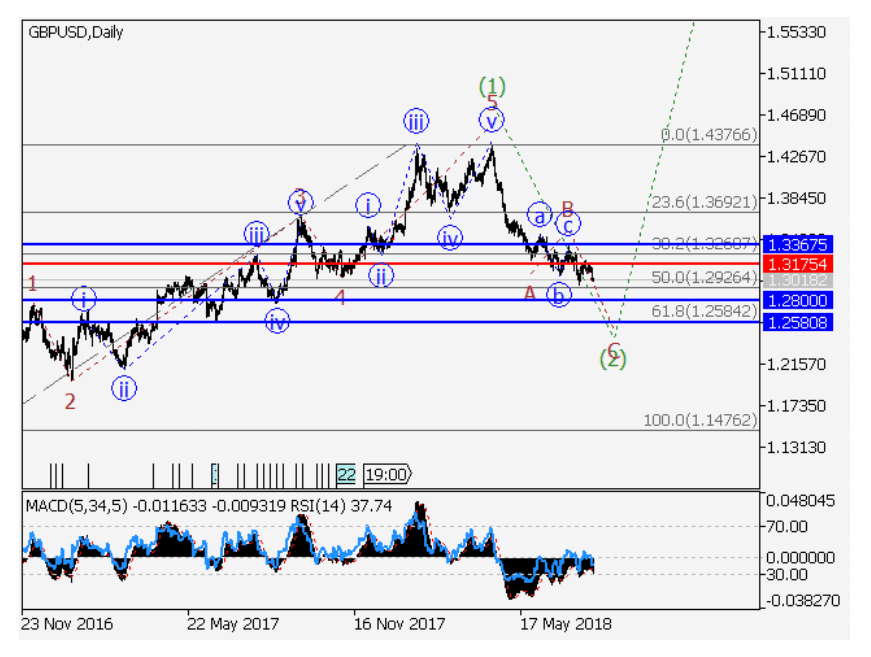
Wave C is made up of five smaller component waves, of which it is currently in wave (iii), with (iv) and (v) still to go.
Once all five waves have unfolded lower C will be complete as will a larger wave 2 and the next broader cycle will begin which should take the exchange rate substantially higher.
Elliot waves are cycles of buying and selling, of rising and falling prices, which are composed of 5 smaller waves numbered 1-5, or labeled using Roman numerals, as in I, II, III, IV, and V.
Waves 1,3 and 5 move in the direction of the dominant trend whilst 2 and 4 represent corrections. Wave 3 is almost always the longest and the strongest wave.
After a 5-wave pattern has finished the market corrects back in a shallower counter-trend move labeled A,B, and C.
Advertisement
Get up to 5% more foreign exchange for international payments by using a specialist provider to get closer to the real market rate and avoid the gaping spreads charged by your bank when providing currency. Learn more here