
- Dollar Rate Today: 1 GBP = 1.2617 USD, 1 EUR = 1.0719
- US Dollar Index: 100.62
- “All these factors combined suggest that we may see further strength for the Pound in the near term"
Technical traders often rely on the old mantra that the "trend is your friend" - if this is indeed the case then bet on further GBP/USD upside in the near-term.
Pound Sterling has been rising against the US Dollar since October and has in the process built some decent momentum over the near-term period.
Generally we would define near-term as encompassing 3-4 weeks and would base studies over this period using a currency pair's daily charts.
Trend analyst Phil Seaton from LS Trader says that based on momentum alone we could expect further advances over coming days and weeks.
“The British Pound has made a short-term breakout to the upside from an extremely narrow trading range and low volatility environment. The rally has been supported by a break above 60 on the RSI and a couple of above average volume days,” says Seaton.
Seaton believes that success in forecasting a currency’s move, and therefore profiting on such a move, is best done by studying its trend.
There are some set rules that define whether a trend is in place; if confirmed then the we should anticipate the financial asset to follow the path of least resistance.
The ability to set and follow rules tends to make for a more objective approach to analysing currency movements and therefore minimises the human error element in forecasting.
Accordingly, in the case of Pound-Dollar, Seaton reckons the trend is higher according to the daily charts.

“All these factors combined suggest that we may see further strength for the Pound in the near term, possibly to as high as the 200-day moving average (currently at 1.3394) over the coming weeks,” says Seaton.
BUT - the long-term trend still remains down warns Seaton.
If one were to observe the weekly charts it is possible to see the exchange rate is still presided over by strong downward forces.
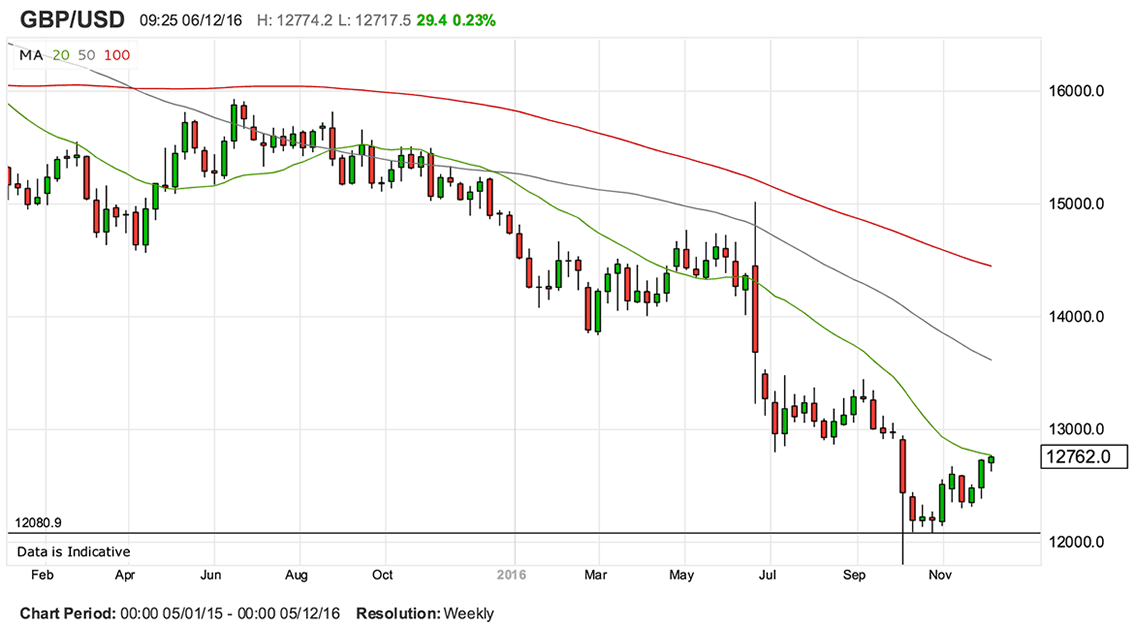
Therefore those chasing GBP/USD higher should be looking at relatively contained moves as long as the longer-term threat for decline remains in place.
But it's About More than Just Following a Trend
Of course, predicting currencies is not as simple as chasing an established trend, therefore there are other indicators to follow and considerations to be made.
FX Strategist Shaun Osborne at TD Securities tells us GBP/CAD's December rally is in fact looking to be in some danger of rolling over.
"The short-term charts are not outright bearish but the trend higher is under pressure and short-term price signals (1-hour and 6-hour charts) suggest that the rally has stalled - and is at some risk, at least, of reversing right here," says Osborne.
Latest Pound / US Dollar Exchange Rates
  | Live: 1.3475▼ -0.48%12 Month Best:1.3867 |
*Your Bank's Retail Rate
| 1.3017 - 1.307 |
**Independent Specialist | 1.3286 - 1.334 Find out why this is a better rate |
* Bank rates according to latest IMTI data.
** RationalFX dealing desk quotation.
The strategist is looking for trend support at 1.2750 and a break below here would suggest risk back to the mid/upper 1.26s.
The question of how long the Dollar's current bull-run can extend.
This current cyclical rally - they usually last five years - has a little further to go.
"Fundamentally, our long term bullish outlook on the Dollar has not changed. We think that the widening disparity between monetary policy stances in the US with Europe, UK and Japan will keep the Dollar underpinned for a long time. Thus what we are seeing right now could be a normal retracement rather than a trend reversal for the dollar," says Fawad Razaqzada, Market Analyst at Forex.com.
In fact the Dollar Index - a broader measure of overall Dollar performance - could very well bounce back if the broken resistance area in the 100.00 region turns into support now.
"It is a massive level, make no mistake about it," says Razaqzada. "There is the potential that it will create a false breakdown to trap the sellers before it bounces back, so watch out for that possibility. It could for example break 100 and drop to 99.00/10 area (old resistance) before bouncing back strongly. In any case, a move back above 100.50 or ideally 101.50 would re-establish the bullish trend."
Razaqada's technical bullish bias would become invalid however if the DXY breaks below support at 99.00.