The GBP to USD conversion held onto gains beyond 1.42 DESPITE news that US Non-Farm Payroll data came in at levels far better levels than many had been expecting.
The British pound has made an impressive recovery through the course of February and recorded its 6th consecutive days of gains as the US dollar stumbles over labour market data.
The headline Non-Farm Payrolls saw the States to have added 242K people to the workforce, markets had only forecat 190K people to have found jobs. This was a very strong outcome indeed.
The dollar should have been higher were it not been for a disappointment in the Average Hourly Earnings numbers where the growth of -0.1% was well short of the forecast 2%.
We find this a surprisingly weak outcome and it would go some way in explaining why the recovery in jobs is not necessarily boosting sentiment amongst the workforce.
Clearly markets agree with us and the message they are communicating via the dollar sell-off is that they do think the numbers will impress Fed Chair Yellen and her fellow decision makers.
Latest Pound / US Dollar Exchange Rates
  | Live: 1.3401▼ -0.06%12 Month Best:1.3867 |
*Your Bank's Retail Rate
| 1.2945 - 1.2999 |
**Independent Specialist | 1.3213 - 1.3267 Find out why this is a better rate |
* Bank rates according to latest IMTI data.
** RationalFX dealing desk quotation.
"While January’s wages soared by 0.5%(m/m), the decline in wages in February will nevertheless dull some of this otherwise strong number’s sheen," say Commonwealth Foreign Exchange in response to the data.
Key for the dollar is the fact that soft wage growth will ultimately keep the Fed on hold.
Commonwealth do warn though that the overall tone of recent data suggests the market may be underpricing risk of policy tightening this year.
If this is the case then we would expect US dollar strength to ultimately return.
Pound to Dollar Recovery Crosses a Key Hurdle
The GBP/USD recovery story is at a key juncture having recorded its best weekly performance since June 2015.
At 1.4231 the GBP/USD is shown to be above its 20 day moving average at 1.4184 on the daily charts.
This suggests the conversion has broken a key resistance point, i.e a place where the market is crowded with sell orders on the recognition that momentum tends to fade at these key points.
The last time sterling breached the 20 day MA, on the 1st of February, the break-out was powerful enough to move the exchange rate from 1.4316 to 1.46499.
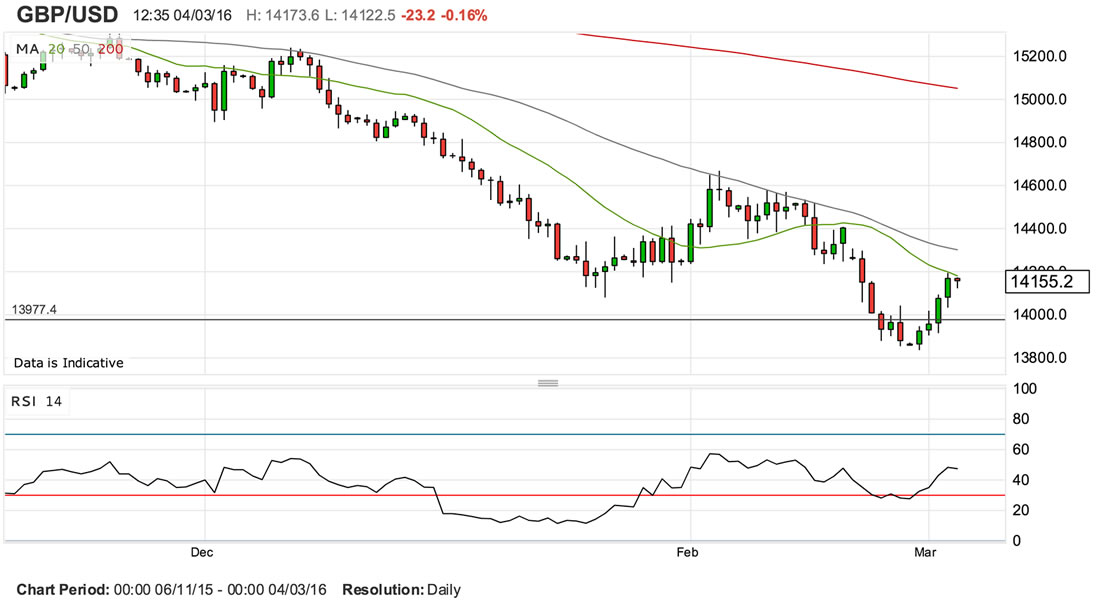
However the recovery then failed at the technically more important 50 day moving average. While history repeat itself in March? If so, then there is not much further for the GBP/USD to go as the 50 day MA is actually close at hand at 1.4303.
A technical analysis from Lloyds Bank more or less agrees with our targets and potential action over coming days.
“The GBP has traded with an underlying bid tone. After rallying off the 1.3915 low, GBPUSD has broken through the initial 1.4080/1.4150 resistance region. The sharpness of the move to some extent illustrates the extremity of the negativity that was priced-in,” says Robin Wilkins at Lloyds Bank.
Technically, Wilkins sees the rebound is reaching importance resistance in the 1.4250/1.4350 area.
“A move through here would suggest a short-term base is in place at 1.3830 and that we are going to develop a broader range between there and 1.4670,” says Wilins.
However, we note that longer-term momentum studies suggest further downside is written into the charts and would expect selling pressure to resume at some point soon.