- GBP/CHF has been in steep downtrend as investor flight to safety helps support CHF
- Market positioning is also heavily short the Franc supporting the rebound
- Action of the central bank is still a risk factor keeping upside potential for CHF limited

© moonrise, Adobe Stock
The Swiss Franc is rising as global investor risk appetite turns sour on the cancellation of the US-North Korea summit, revived Trump protectionism and Italexit outlier, however, the Franc looks vulnerable against the Pound.
The currency is what is known as a safe-haven which means it gains when things go awry, yet that is not the only reason.
The Franc is also the most oversold currency in the G10, according to Stephen Gallo, FX strategist at BMO.
"The latest IMM data for May 15th have confirmed that short-CHF is the largest position in G10 held by leveraged accounts (i.e. when the total USD value of CHF short positions is scaled to its 3Y max)," says Gallo.
When investors are extremely bearish a currency it is normally a signal the opposite will happen, so CHF would normally be expected to continue rising, however, Gallo is not staunchly bearish EUR/CHF or USD/CHF.
Why? The problem, in three words, is the Swiss National Bank (SNB), which has a profoundly weak-Franc policy, is the most interventionalist central bank in the world, and is, therefore, likely to keep any CHF-upside contained by entering the market selling Francs.
"We would be EURCHF sellers here, but we would expect the aforementioned range to act as a floor. Why? It’s because SNB intervention tends to be countercyclical; that is, SNB intervention tends to increase when the EUR is weakening and it tends to decrease when the EUR is strengthening," says Gallo.
In short there are still risks to to downside for the Franc if the SNB intervenes.
GBP/CHF is a case in point as despite the current downtrend it giving off bullish chart signals.
The pair has reached an oversold extreme and given a bullish signal which suggests the potential for an upside recovery in the Pound.
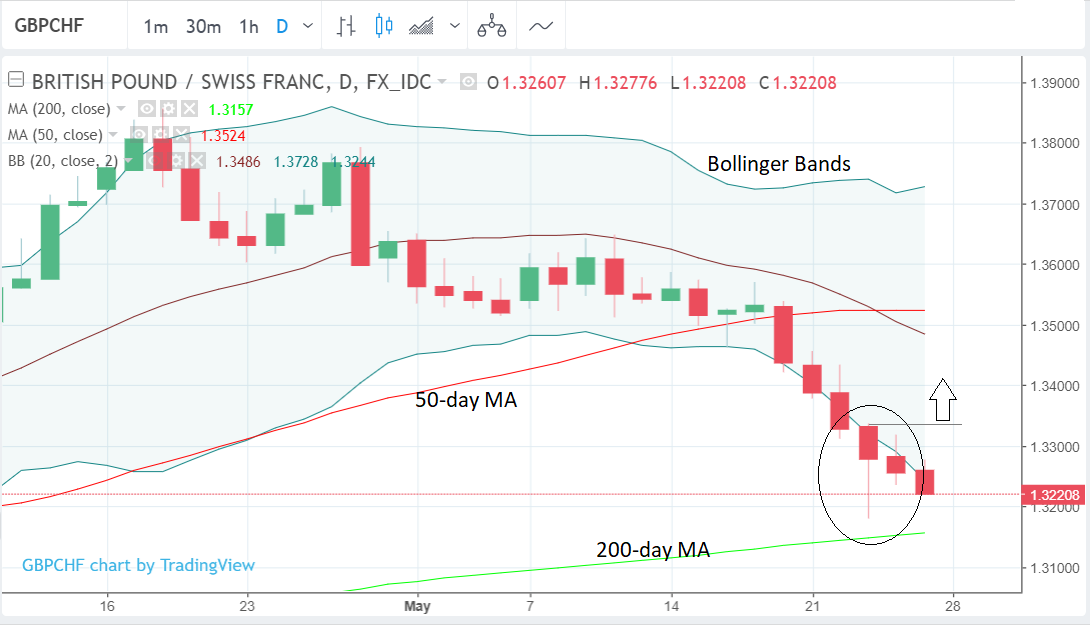
We note the chart is showing a longer-than-average range day (circled above) poking down below the lower band of a price channel indicator called a Bollinger Band, which has boundaries at two standard deviations from the 20-day moving average (MA) of the exchange rate.
The Bollinger Band tends to be useful at flagging up extremes. GBP/CHF's oversold low candlestick circled on the chart below, is a bullish signal of about a 4 star quality. It may indicate a recovery back up towards circa the 50-day at around 1.35, but first we would need a break above the circled day's highs at 1.3337.
The location of the 200-day, just below the current lows at 1.3157, places a further floor on the exchange rate since 200-days often act as obstacles preventing further downside and sometimes are even the locations for reversals of the trend.
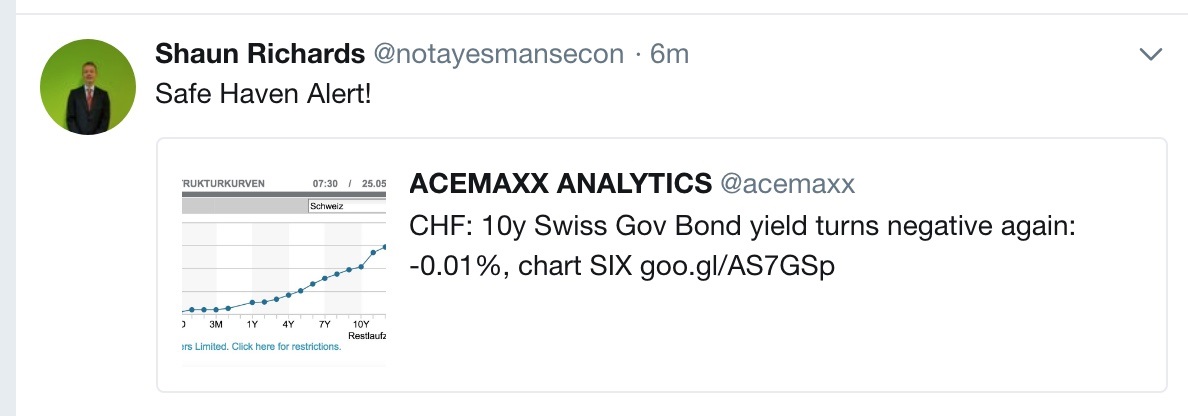
The Swiss bond market is providing other evidence supporting our bullish GBP/CHF conviction.
Yields on Swiss bonds are falling, as flagged up by the tweet below from Acemaxx Analytic, which suggests further weakness on the horizon for CHF, and consequent potential upside pressure for GBP/CHF.
Get up to 5% more foreign exchange by using a specialist provider to get closer to the real market rate and avoid the gaping spreads charged by your bank when providing currency. Learn more here.