
The British Pound has advanced against the Australian Dollar for two weeks now, but there are signals warning that the upside impetus may be fading.
The GBP/AUD exchange rate has risen for a second consecutive week.
The pair started the week at 1.7155 and closed at 1.7361. The open on Monday the 16th August was at 1.6894.
So momentum in the pair is turning positive in the short-term in line with our forecasts made at the start of the week.
The bullish forecast was based on observations that the previous week's lows had formed several bullish Japanese candlestick patterns, including a Three Outside Up and Three White Soldiers pattern.
Now, the pair is giving fresh signals, but this time they are negative.
GBP/AUD has formed a head and shoulders pattern, most clearly visible on the hourly chart, which suggests the current short-term up-trend may be in peril of breaking down:
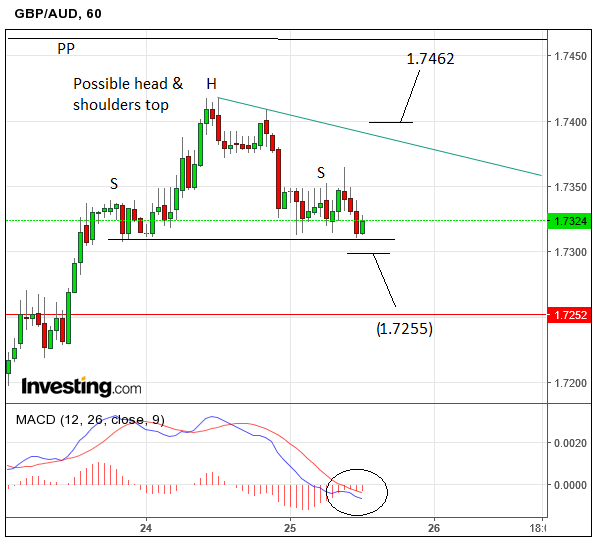
Head and shoulders (H&S) are composed of three peaks with the middle peak (the head) higher than the other two (the shoulders).
The pattern is a potent bearish trend reversal signal; with bearish ‘activation’ confirmation coming from a break below the ‘neckline’ or lows of the troughs in between the peaks.
In the case of the H&S on GBP/AUD, the neckline is at 1.7320 so a clear break below that level, confirmed by a move below 1.7310, would probably be sufficient to signal a continuation down to a minimum target at 1.7255.
The MACD on the hourly chart below has moved below zero indicating the trend is now on balance bearish.
Latest Pound / Australian Dollar Exchange Rates
  | Live: 1.9084▼ -0.13%12 Month Best:2.1005 |
*Your Bank's Retail Rate
| 1.8435 - 1.8511 |
**Independent Specialist | 1.8817 - 1.8893 Find out why this is a better rate |
* Bank rates according to latest IMTI data.
** RationalFX dealing desk quotation.
Alternatively, it May be the H&S is a ‘fake’ in which case it will not break lower but eventually move higher, continuing the dominant up-trend.
In fact, until the neckline is breached this remains our preferred scenario.
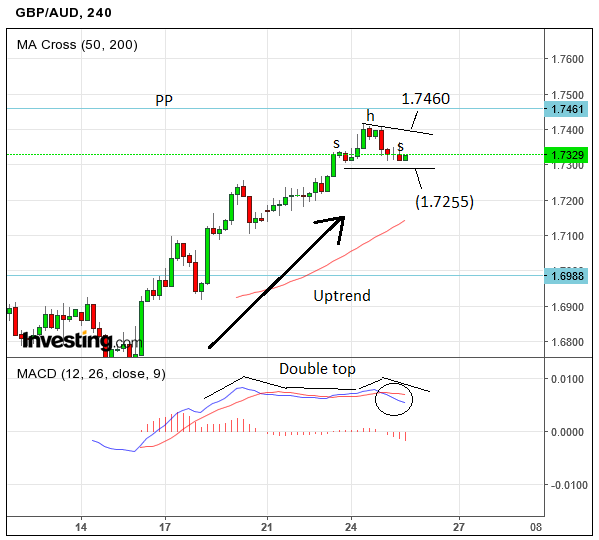
The H&S will fail if the exchange rate moves above the trend-line drawn down from the head at 1.7400, activating a subsequent upside target at 1.7460, where the monthly pivot – a formidable barrier to more upside – is situated.
Nevertheless, the particularly bearish-looking MACD indicator in the lower pane of the four-hour chart below, which has formed a bearish 'double-top' reversal pattern and moved below its signal line, is adding weight of evidence to the H&S genuinely breaking lower to 1.7255.
Second quarter GDP and Business Investment data from the UK, out on Friday, may provide the trigger for a change in the exchange rate, or a break down or up in the H&S pattern.
Currently analysts expect GDP to come out the same as the preliminary estimates at 0.6% qoq and 2.2% yoy.
Business Investment is forecast to show a deeper -0.8% contraction from the -0.6% previously, due to companies putting investment plans on hold until after the Brexit referendum was known.