Image © Adobe Images
- GBP/ZAR in short-term uptrend capped by major trendline
- More upside likely to hit resistance then poll-back
- Rand to be moved by global risk trends, oil prices and SA manufacturing
The Pound-to-Rand exchange rate is trading at around 18.71 at the start of the new week, up 0.69% already on the week before.
Studies of the charts suggest the pair could rise up a little further in the short-term but then after that it will probably pull-back on encountering tough resistance at a major trendline.
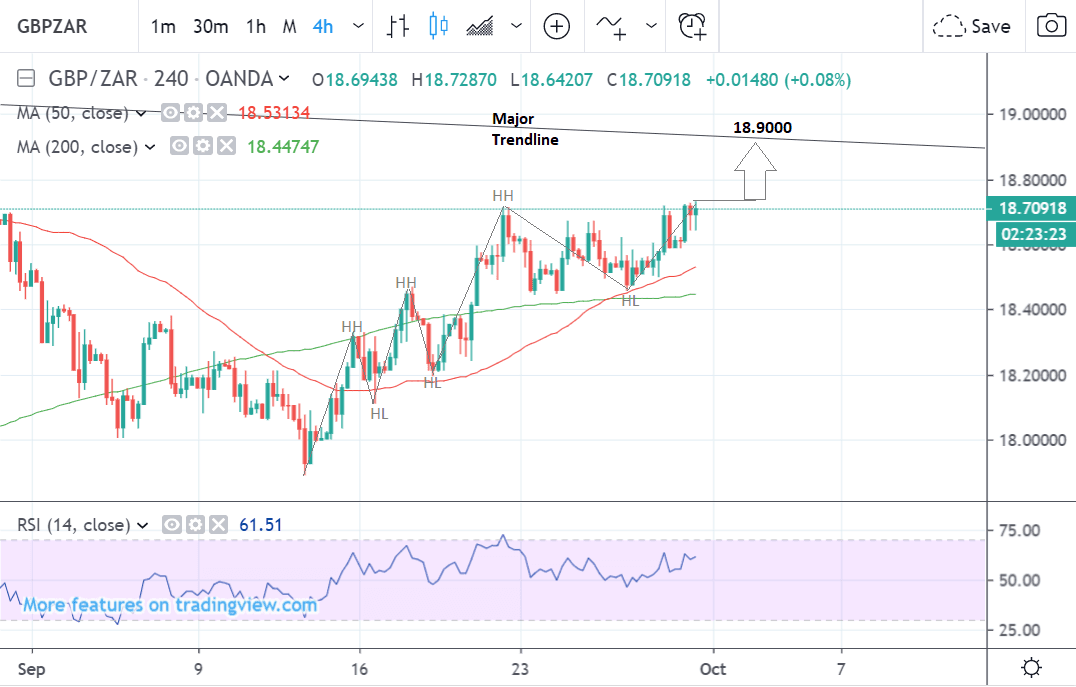
The 4hr chart - used to determine the short-term outlook which includes the coming week or next 5 days - shows the pair in a new short-term uptrend since bottoming at the September 12 lows.
Since ‘the trend is your friend’ this uptrend is biased to continuing higher, with a break above 18.75 highs providing confirmation for more upside to the next target at 18.90 at the level of a major trendline.
At that point, the pair is likely to stall and pull-back as technical sellers enter the market.
The daily chart tells a similar story and overall we think the pair may struggle to break out above the major trendline capping gains at 1.1890.
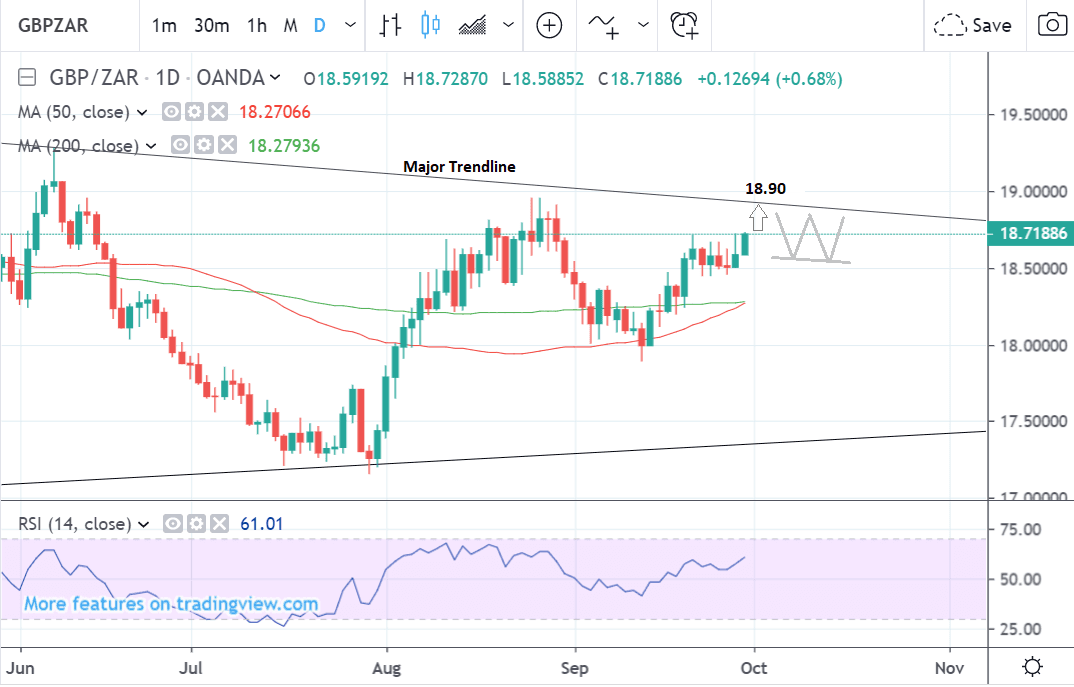
What is perhaps more likely is that the pair will pull-back down after touching the trendline.
After that, it might also go sideways for a time consolidating before the next directional move.
The daily chart is used to give us an indication of the outlook for the medium-term, defined as the next week to a month ahead.
The weekly chart shows why we see the pair trapped below the circa 19.00 level - the trendline has successfully capped gains over the long-term and could very well continue to.
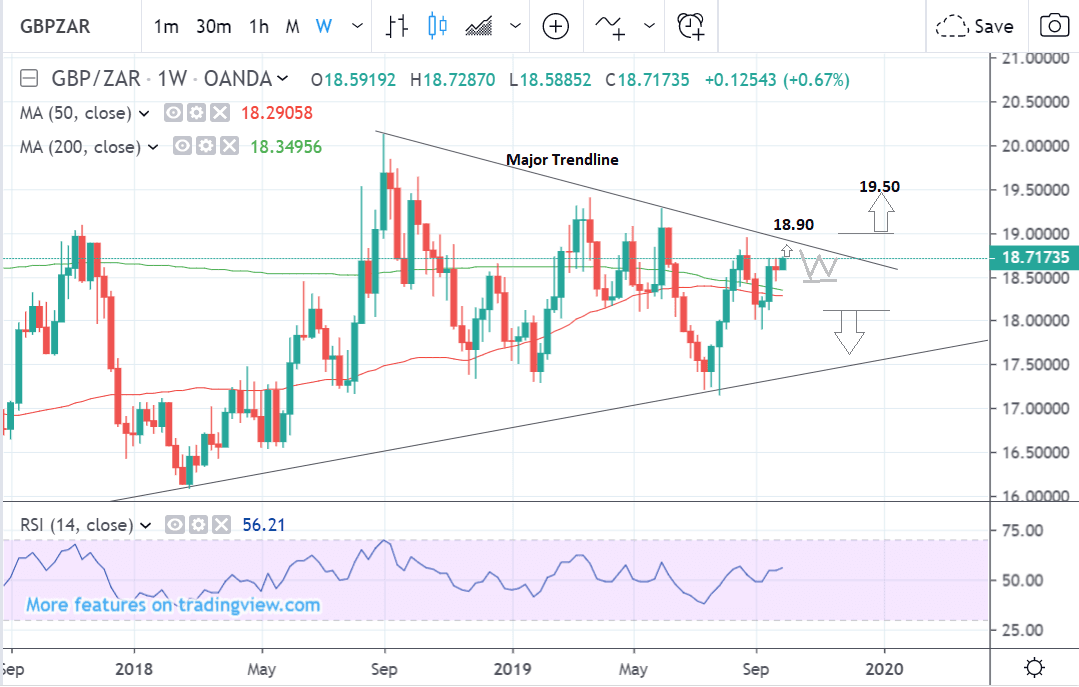
Nevertheless, as time goes by there is an increasing probability the pair will break out in one direction or another.
A move above 19.00 would provide confirmation for a bullish breakout whilst a move below 18.20 would provide bearish confirmation.
The 50 and 200 weekly moving averages are situated between 18.28 and 18.34 and these would have to be clearly pierced below for confirmation of more downside.
Major MAs are usually strong support levels limiting downside.
The weekly chart is used to give us an indication of the outlook for the long-term, defined as the next few months.
Time to move your money? Get 3-5% more currency than your bank would offer by using the services of foreign exchange specialists at RationalFX. A specialist broker can deliver you an exchange rate closer to the real market rate, thereby saving you substantial quantities of currency. Find out more here.
* Advertisement
The South African Rand: Key Drivers to Watch this Week
The main drivers of the South African Rand on the horizon are global risk trends, the fluctuations of the U.S. Dollar, to which the Rand is highly negatively correlated, and Manufacturing PMI data.
South Africa today reported a trade surplus for August, with a reading of R6.8BN, driven by a rise in mineral exports. Typically, news that a country is earning more than it is buying on the international market would be supportive of that nation's currency.
However, "the outcome, notably above consensus expectations of a R1.2bn surplus, was ignored by the Rand, which remained driven by the elevation in global financial market risk aversion," says Annabel Bishop, an economist with Investec.
Global risk trends have eased for the time being after China reported better-than-expected Manufacturing PMI data on Monday, although the news that the U.S. might be preparing to restrict investment flows into China (and of Chinese investors in U.S. assets) somewhat took the shine of the data.
"The Rand continues to follow global events, ignoring the ANC’s NEC meeting over the weekend where Finance Minister Mboweni presented National Treasury’s economic growth plan to save South Africa from the declining growth trend it has been on since 2011, where GDP has fallen from 3.3%, to 0.8% y/y last year, and likely around 0.5% y/y this year," says Bishop.
Oil prices are another exogenous factor to watch for the South African currency. The spike higher in oil prices following the Saudi drone-strike also impacted on the risk assets as higher oil means more expensive fuel which increases base costs for many South African businesses.
September has seen the rand oil price rise to R925/bbl to date, well up on the average in August of R904/bbl.
Since then the oil price has fallen back down to pre-strike levels, a trend that would be supportive of the currency if it extends.
News the Saudi oil production is back up to old prior levels and that the Saudi’s have called a ceasefire in Yemen - thought to be the original cause of the attack - have helped reduce chances of another attack and supply fears.
Oil prices have also been helped by news the U.S. may ease up on Iran in terms of sanctions and if the country can start exporting oil again it would increase global oil supply.
As far as SA domestic data goes, the main release is SA Manufacturing PMI out on Thursday at 8.15 BST.
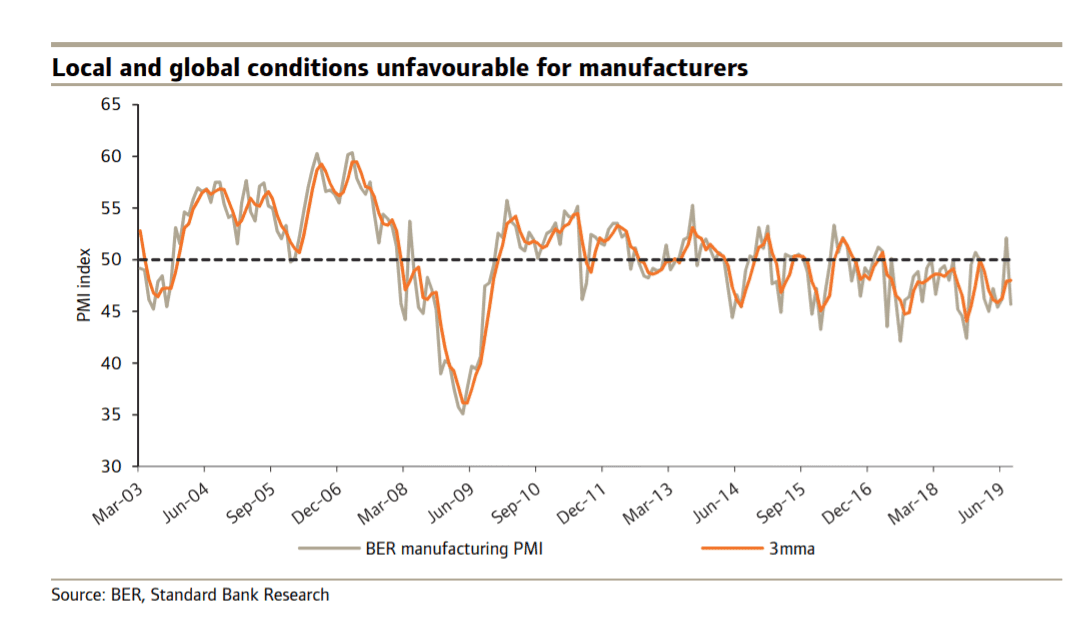
Global manufacturing has been hit hardest by the trade war and the data will be closely scrutinised for signs of how the tensions are impacting on the SA manufacturing sector.
“The BER manufacturing September PMI tomorrow will shed more light on the conditions faced by SA manufacturers,” says Thanda Sithole, an economist at Standard Bank. “In August, the seasonally adjusted BER PMI slipped below the 50-point neutral threshold, to 45.7, from 52.1 index points in July.”
* Advertisement