Image © Pound Sterling Live
- GBP/ZAR break below range lows suggests bearish outlook
- Major trendline currently providing floor
- Rand impacted by global outlook
The Pound-to Rand exchange rate is trading at around 17.83 on Monday morning, after falling over two percent in the previous week, but studies of the charts suggest the pair could go sideways after meeting major support, and a risk of further weakness if it breaks below.
The pair recently broke below the floor of a long-term range at 18.04 in a surprisingly bearish move. It then fell down to a major trendline in the 17.80s where it is trading at the moment, as evidenced in the short-term 4-hour chart below:
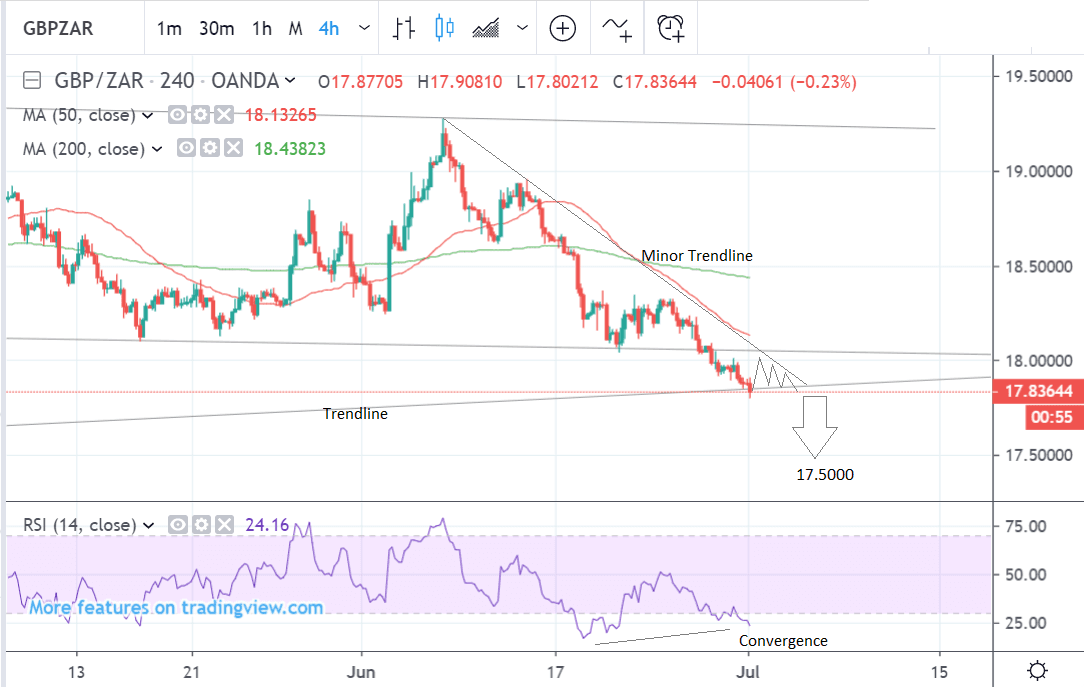
The trendline is expected to provide a robust floor of support and suggests a possible bounce and sideways trend could evolve between the 18.04 range lows and the 17.80s.
The RSI momentum indicator in the lower pane is giving a bullish signal which supports the possibility of a bounce and sideways move developing.
The RSI is converging with price. Convergence happens when price makes a new low but RSI does not. It indicates waning downside momentum.
The sideways move will probably extend for a while and then - conditional on a break below 17.80 - fall to the next downside target at 17.50.
The 4-hour chart is used to analyse the short-term trend, which means the next 5 days or week of trading activity.
The daily chart meanwhile shows the old range more clearly and how the pair recently broke out of the bottom of that range and fell to the trendline.
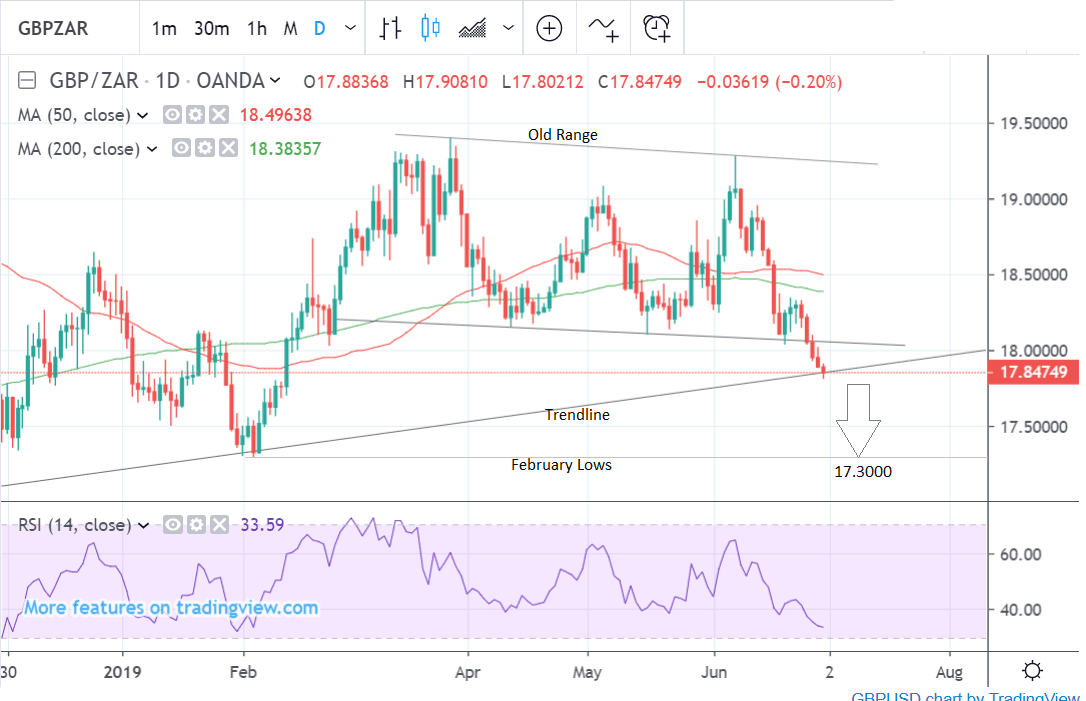
Assuming a break below the trendline - confirmed by a daily close below 17.80 - the pair will probably accelerate its decline to a target at the 17.30 February lows over the medium-term.
The RSI momentum indicator in the bottom panel is bearishly falling in tandem with price.
We use the daily chart above to analyse the medium-term trend which includes the next 1-4 weeks of price action.
The weekly chart shows the pair rising in a channel over the long-term. The trendline currently providing support is actually the lower borderline of the channel.
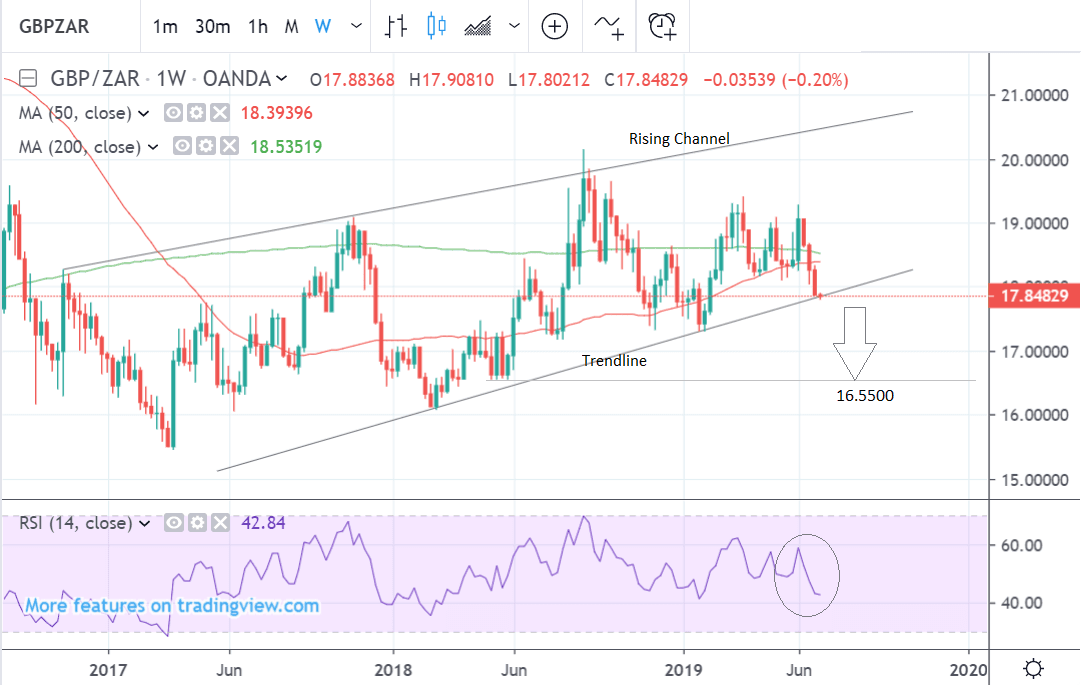
A breakout from the channel would be a very bearish sign for the pair which could decline to the May 2018 lows at 16.55 eventually.
The RSI momentum indicator in the lower pane has fallen in line with price which is a bearish sign.
The weekly chart is used to analyse the long-term forecasting horizon, defined as between 1-4 months into the future.
Time to move your money? Get 3-5% more currency than your bank would offer by using the services of foreign exchange specialists at RationalFX. A specialist broker can deliver you an exchange rate closer to the real market rate, thereby saving you substantial quantities of currency. Find out more here.
* Advertisement
The South African Rand: What to Watch this Week
The main driver of the Rand in the week ahead is likely to be global risk trends and the outlook for the U.S. Dollar.
The Rand gained a boost on Monday from the positive news from the G20 regarding U.S - China talks.
President Trump lifted the ban on U.S companies selling components to Huawei in exchange for China purchasing more U.S agricultural products.
Both sides also said they would not be raising further tariffs for the foreseeable future.
"President Trump agreed a détente with President Jinping, bringing some respite from the ongoing trade war. It should provide some short-term relief to markets," says Sebastian Burnside, Chief Economist at RBS, adding:
"The trade war has been impacting economic activity in recent quarters, clouding the global outlook. Meanwhile the threat of a further dose of tariffs on the remaining $300bn or so of Chinese exports to the U.S. was looming. So markets were hoping for signs of progress between Presidents Jinping and Trump at the past weekend’s G20. They got their wish."
Risky emerging market assets, stocks, commodity currencies and the Dollar all rose on Monday morning as a result of the news. The Rand also participated as it tends to benefit in times of improved investor sentiment.
Nevertheless, the early bullish exuberance from the G20 was tempered somewhat by some negative data from China, Australia and Japan which suggested not all is well with the global economy.
The main release was Chinese Caixin PMI, which is a survey-based leading activity indicator for smaller and medium-sized businesses in China, which is used to complement the official PMI.
Caixin manufacturing fell from 50.2 to 49.4 in June when it had been expected to fall to only 50.0. This is significant because the 50.0 level distinguishes contraction from growth, and it means Caixin manufacturing has joined the larger corporate PMI in contraction territory. The official PMI also undershot, coming out at 49.4 instead of 49.5.
PMI’s for all economies will be out this week providing a leading indication of global growth, and this may impact on the Rand if the negative trend set by Chinese and Australian data so far spreads.
U.S Non-Farm Payrolls data could also impact the Rand when it is released on Friday at 13.30.
This is a major release for the U.S economy and will be used by policymakers to judge whether the Federal Reserve should cut rates to stimulate growth or not.
Talk of a rate cut over the last two weeks has helped support the Rand and if NFP’s are below 100k again as they were in May when they came out at only 74k, the case for a cut will increase, with positive connotations for the Rand.
* Advertisement