GBP/USD has been going sideways during April following its steep rally at the end of March.
The current range-bound consolidation has however started to move higher and has broken above the range highs indicating the possibility of a resumption of the up-trend.
The breakout, albeit minor, is a strong bullish signal indicating enhanced probabilities of a continuation higher.
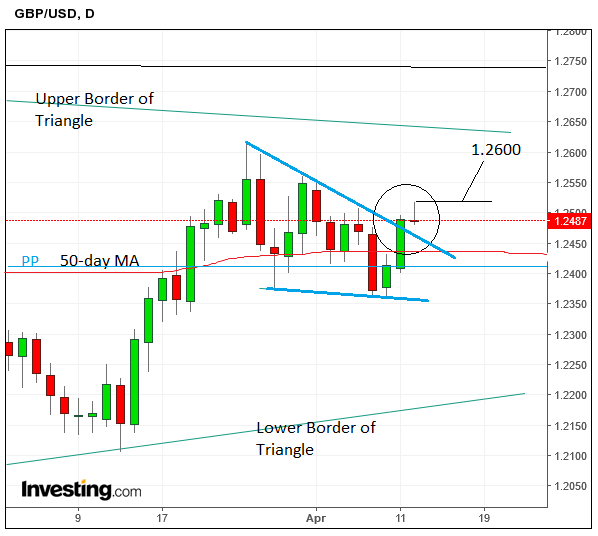
A move above the day's highs at 1.2520 would confirm a continuation up to the target at 1.2600.
This is at the level of the upper border of a large symmetrical triangle which has been forming since the rebound from the October 2016 lows.
The border is likely to be more difficult to pierce due to incoming supply from traders selling the pair at that level, expecting it to pull-back.
The 200-day moving average (MA) is also situated at the same level and likely to resist further upside too.
Moving averages can be very tough to break.

The Pound to Dollar is currently in a wave-e of a symmetrical triangle.
Symmetrical triangles normally have five component waves (a-e). This is likely to be the final wave and there is a high chance of a breakout once the wave finishes.
A break above the late February c-wave highs at 1.2715 would provide confirmation of a breakout from the triangle pattern and above the 200-day MA, targeting a final price expectation of 1.3200.
This calculated based on the height of the triangle multiplied by the golden ratio of 61.8%, a mathematical principle which governs patterns in nature, and is used in one of the rules for forecasting triangle breakouts.
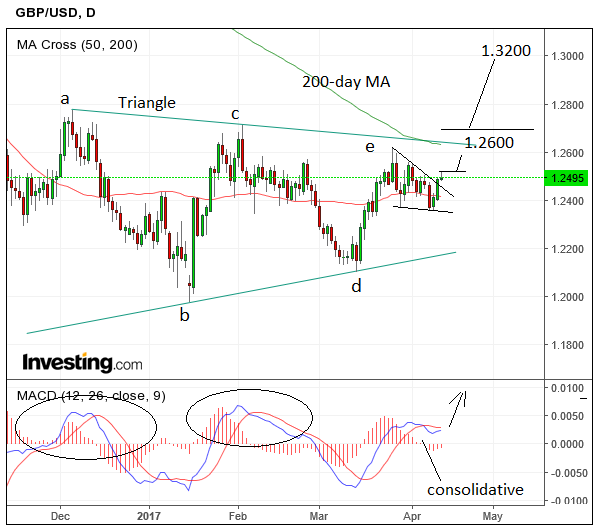
Alternatively, the pair could rotate at the level of the upper border and the MA just above 1.2600 and fall back down within the triangle, eventually breaking out to the downside instead, since this is a symmetrical triangle which means there is no inherent bias in the direction of the final break.