- GBP/NZD in short-term downtrend
- Which is expected to extend
- No real support seen on charts until 1.89s
- Key release next week is the Trade Balance for September
- New record deficit a threat

- GBP/NZD reference rates at publication:
Spot: 1.9216 - High street bank rates (indicative band): 1.8543-1.8678
- Payment specialist rates (indicative band): 1.9043-1.9120
- Find out about specialist rates, here
- Or, set up an exchange rate alert, here
The Pound-to-New Zealand Dollar rate is trading at around 1.9219 at the time of writing after falling ~1.00% in the week before. Studies of the charts suggest the pair will continue falling in line with the dominant downtrend.
The 4 hour chart - used to determine the short-term outlook, which includes the coming week or next 5 days - shows the pair is in a sharp downtrend that is likely to extend in the week ahead, especially given the lack of major support underpinning the exchange rate.
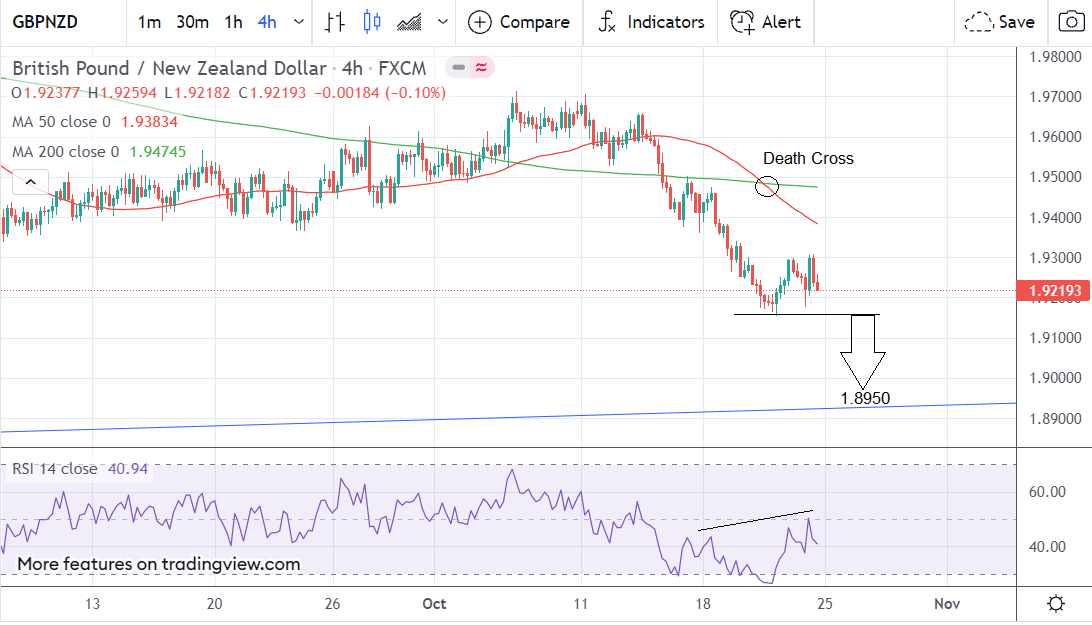
A break below last week’s 1.9157 lows will unlock more selling to a possible target at the level of the major trendline at roughly 1.8950. At that level bulls will be expected to come in and offer support.
The 50-4hr MA recently crossed below the 200-4hr MA in what is known as a Death Cross - generally considered a strongly bearish signal.
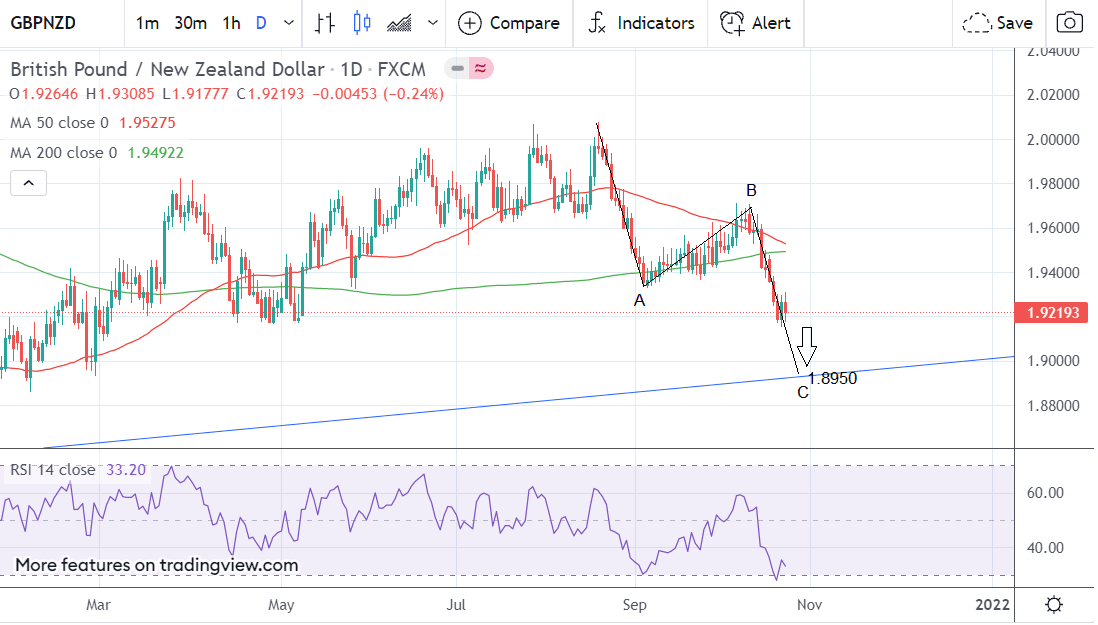
The daily chart - which shows how the trend could play out over the medium-term, or next week to month - shows the pair forming a measured move pattern that started at the August 19 highs.
These patterns are symmetrical 3-wave zig-zags, where the final 3rd wave down (C) is usually of a similar length to the first wave (A), or fibonacci extension thereof. The pattern on GBP/NZD has probably not yet finished, since C is still not as long as A, suggesting price has further to fall.
The endpoint of C also corresponds with the level of the major trendline at around the 1.8950 mark giving further credence to this as a possible target.
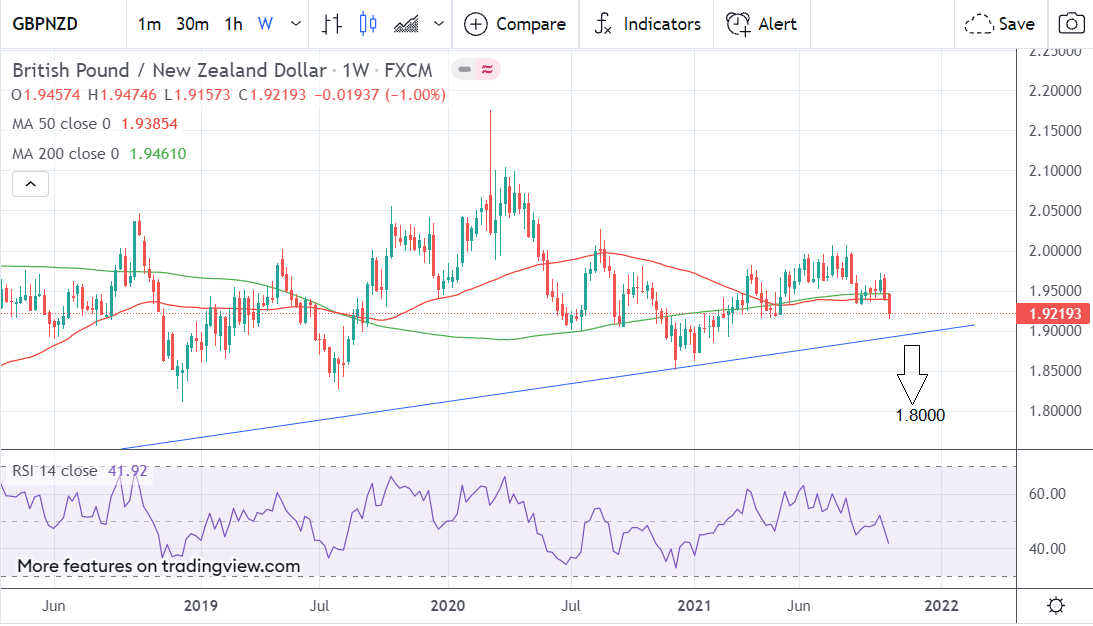
The weekly chart - used to give an idea of the longer-term outlook, which includes the next few months - is showing a bearish picture too, albeit within a sideways trending secular market.
The pair has successfully broken below both the 50 and 200-week moving averages; it has also formed an extremely bearish long red candlestick last week which suggests a continuation lower.
A successful break below the long-term trendline at 1.8950 would probably usher in a move down to support at the key 1.8500 region, followed by 1.8000 on the weeklies.
The New Zealand Dollar: What to Watch this Week
The key data release for the Kiwi Dollar in the week ahead is Trade Balance data for September, out at 21.45 GMT, on Tuesday, October 26.
The Trade balance, released by Statistics New Zealand, is the difference between the value of its exports and imports, over a period of year.
A deficit is normally negative for the currency since it suggests a less competitive economy and lower direct demand for the country’s currency by other nations needing to buy its products.
New Zealand experienced its worst trade deficit on record in August after it widened to N$2,144 million from NZD N$299 million in the corresponding month of the previous year. This constituted a 38.4% rise in imports from a year earlier.
It was caused by a jump in imports of vehicles, parts, and accessories.
If the trade deficit continues to grow in September, there is a risk the data may weigh on the Kiwi.