The Pound-to-Euro rate is currently falling within a range but is forecast to eventually break higher and rise up to a target in the 1.16 area.
The Pound-to-Euro exchange rate is trading between a range ceiling around the 1.1450-1.1500 area and a range floor at 1.1175.
We see it as most likely the rate will eventually break higher once the sideways movement is complete, something that is supported by Sterling’s undervaluation, but this could be a somewhat distant outcome.
For now, the Pound is still falling within its range. A move that is shown by the wave labelled “e” on the chart below.
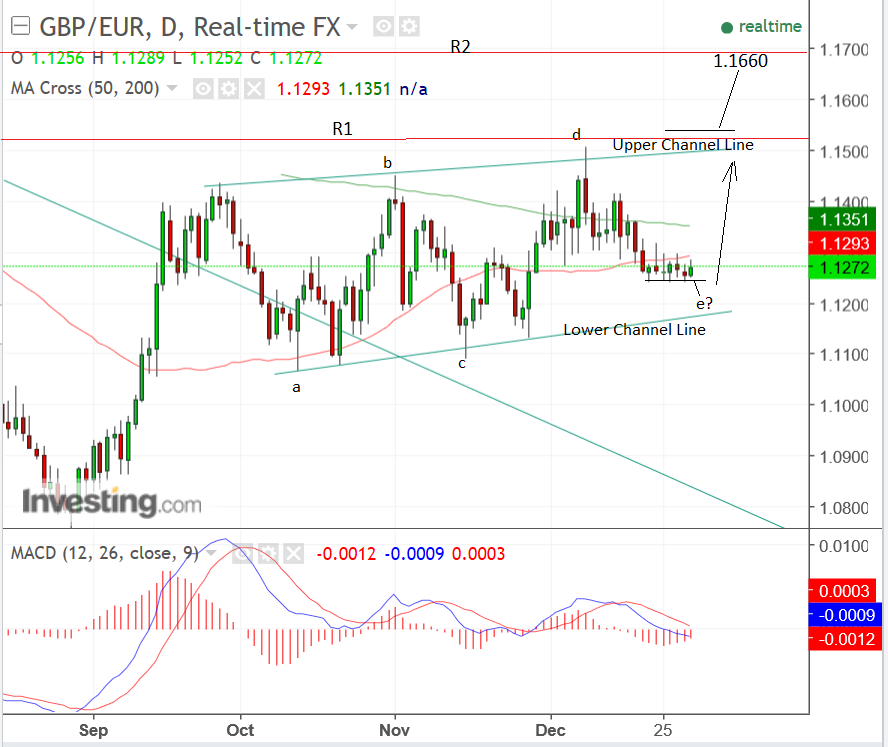
Above: Chart Pound-to-Euro rate over fourth-quarter 2017.
The pair has formed four constituent waves (a-d) within its current channel, or range, and is probably in the process of forming the fifth (e) as it slides lower.
Most range-bound consolidations such as this are composed of a minimum of five waves. That Sterling’s is in the process of forming wave “e” could suggest the current consolidation is near to finishing.
There indications the current 'e' wave is running out of steam and could be about to reverse, however, these are not compelling enough for us to predict short-term upside just yet.
The four-hour time interval chart below shows the recent downward trend, or wave 'e', in more detail. Peaks and troughs of recent price action and the gradual step-sequence lower are clear.
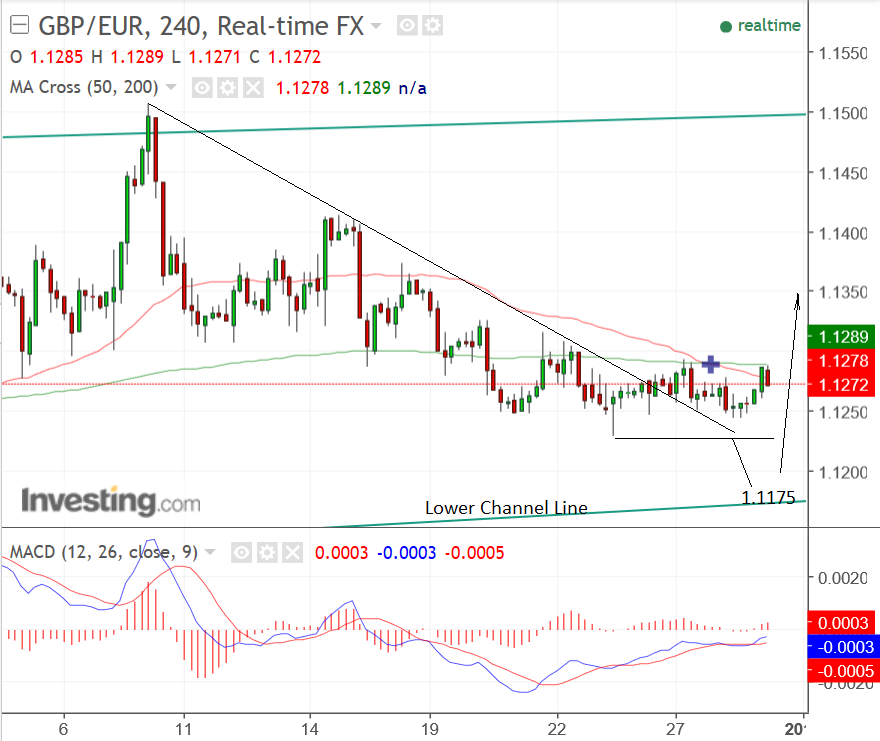
Above: Pound-to-Euro rate shown at four-hour intervals.
The Moving Average Convergence Divergence (MACD) indicator in the lower pane of the chart above shows momentum rising at the same time as the market is falling.
This could mean the downtrend is losing strength, opening the door to a possible reversal however, one solitary indicator alone is not enough to convince us of a change in trend.
In fact, we see the possibility of a final push lower within the range taking place in the very short-term, which might then exhaust the downward move and pave the way for an eventual breakout higher.
That said, if the price breaks below the December 25 lows of 1.1230 it would indicate the downtrend remains intact, signalling another downward move to a target of 1.1175 is possible.
On a separate note, a break above the 1.1545 level should confirm a clearance of past resistance and would indicate a move higher into new uncharted territory.
However, there is a tough level of chart resistance at 1.1514 (represented by the red line labelled R1), where the exchange rate is expected to encounter fierce selling pressure.
We extrapolate the height of the current range in order to forecast the contours of an eventual breakout.
Although this is often an accurate method of determining a target, we have opted to combine it with an awareness of tough resistance levels on the chart, where we expect more selling pressure to emerge.
This gives us a target of 1.1660, just below the 1.1665 resistance level, which also acts as the monthly pivot.
Monthly pivots can act as obstacles to trends since traders often anticipate that prices will meet resistance at these levels, which leads to increased order flow around them as speculators attempt to make a quick profit.
Get up to 5% more foreign exchange by using a specialist provider by getting closer to the real market rate and avoid the gaping spreads charged by your bank for international payments. Learn more here.
GBP Index Performance Supports Upside Hypothesis
That Sterling is biased to rise is supported by analysis from The Technical Trader, Bill McNamara, who notes how the official Bank of England (BOE) chart of the Pound index (see below) suggests the currency is significantly undervalued.
The Pound index is an amalgam of the Sterling’s performance against the Euro and the Dollar.
"Although most commentators (including yours truly) tend to focus on the relationship between sterling and the dollar (or the euro), the index put together by the BoE is useful as it amalgamates the two and, in one useful snapshot, highlights the degree to which the UK currency has been devalued since it topped out at 94.1 in August 2015."
The index is still some 17.0% below its peak seen in 2015 and 11.0% below the pre-referendum level.
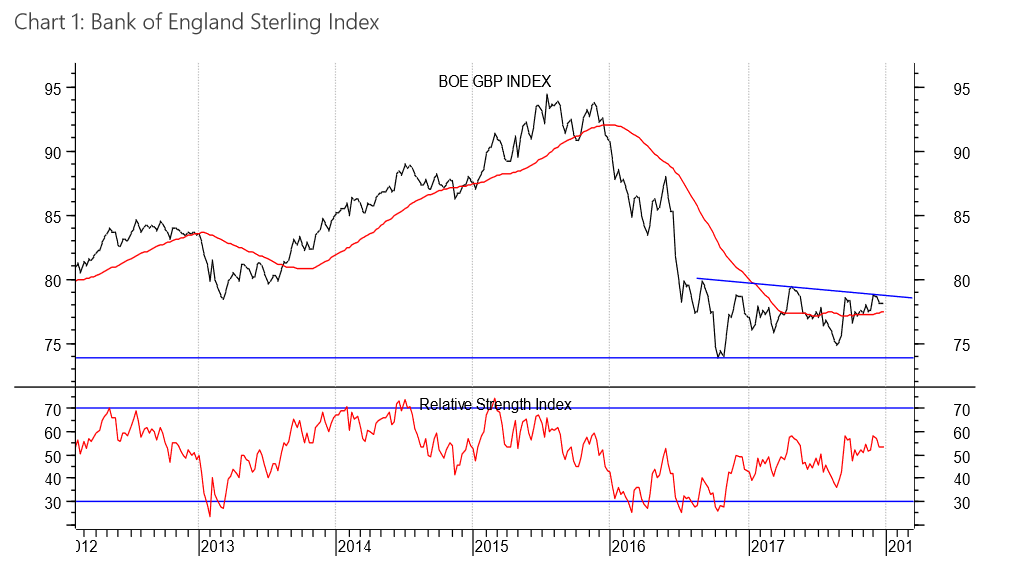
Above: Bank of England's Sterling Index. Taken from The Technical Trader research report.
Get up to 5% more foreign exchange by using a specialist provider by getting closer to the real market rate and avoid the gaping spreads charged by your bank for international payments. Learn more here.