Image © Bank of Canada
- We maintain our overall negative outlook for USD/CAD
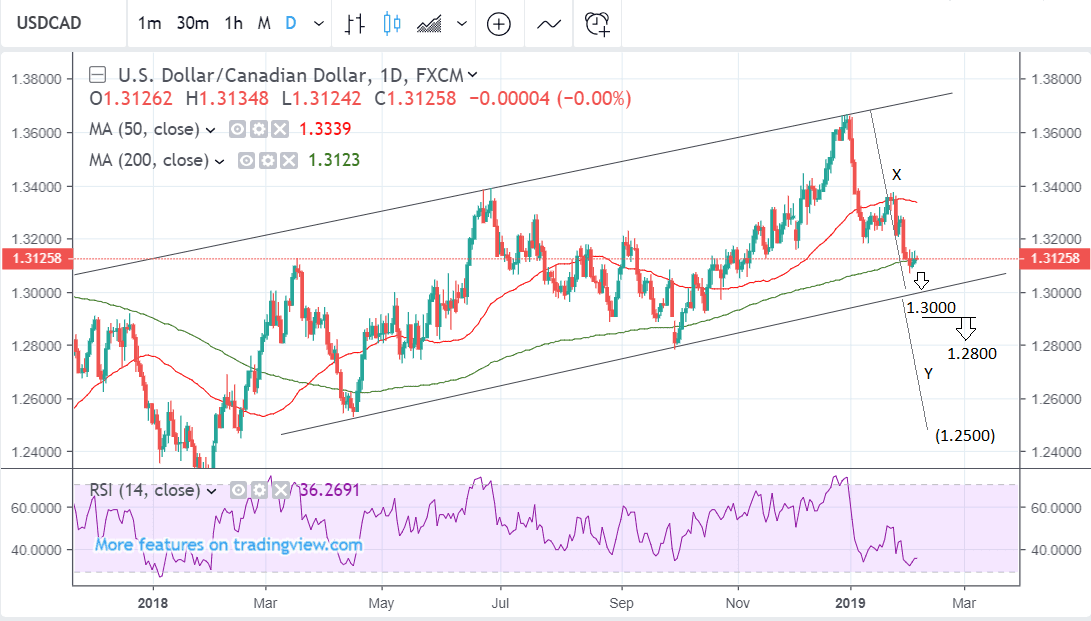
- USD/CAD may have fallen to the base of the channel
- Monthly chart is looking bearish after decline in January
The U.S. Dollar / Canadian Dollar exchange rate is trading at 1.3125 at the time of writing after falling to the base of its rising channel.
Mixed opinions about the outlook for the Canadian Dollar probably mean the main fundamental driver for the weakness was a decline in the U.S. Dollar rather than independent moves in the Canadian unit, following a general downgrade in expectations for U.S. growth in 2019.
Setting the debate over fundamentals aside, from a technical perspective we note the pair is now threatening to bearish breakout from the underside of its rising channel, and if it is successful it could probably fall all the way down to a target at circa 1.2800 initially, and probably even lower.
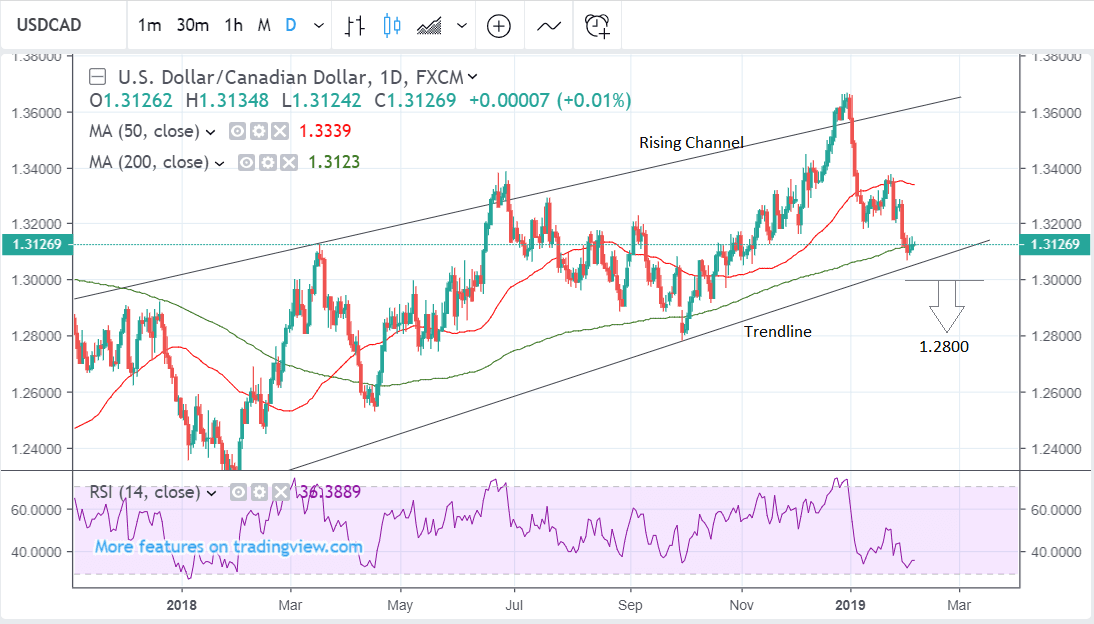
If the exchange rate falls through 1.3000 it would probably confirm a successful breakdown for USD/CAD and result in a test of a target set at 1.2800.
Many technical obstacles lie in the way of further weakness however, including several large moving averages, such as the 200-day, 50-week, 200-week, and 50-month.
As such it is also possible the pair could bounce instead, although given the short-term trend now appears to be bearish after the sharp declines in January, we maintain our overall negative outlook.
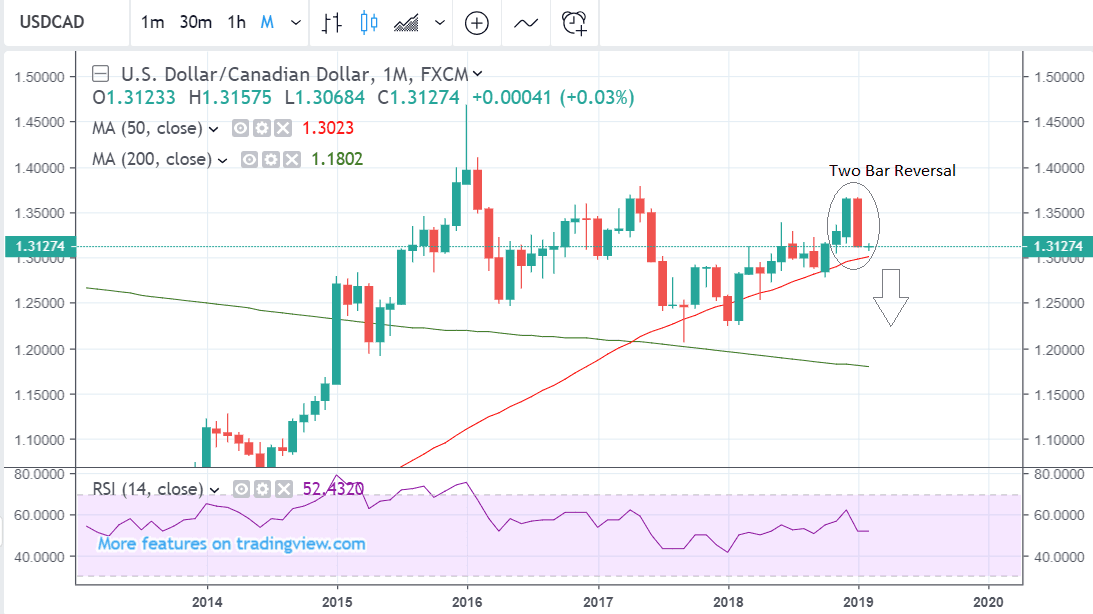
The monthly chart is bearish and supports a negative interpretation for the exchange rate.
The pair has formed a two-bar reversal pattern at the highs during December ‘18 and January ‘19 which strongly suggests more downside for the exchange rate - if not immediately then at least within a few months.
The two-bar reversal occurs when a long up bar at the end of an uptrend is followed by long down-bar with the same or very similar high, as has been the case in USD/CAD.
Although the exchange rate should break below the 50-month MA in order to confirm a move lower, this is, nevertheless, still quite possible. A recovery from the current level just does not look nearly as probable as a decline - to the experienced analyst’s eye.
Time to move your money? Get 3-5% more currency than your bank would offer by using the services of foreign exchange specialists at RationalFX. A specialist broker can deliver you an exchange rate closer to the real market rate, thereby saving you substantial quantities of currency. Find out more here.
* Advertisement
Where we Could be Wrong
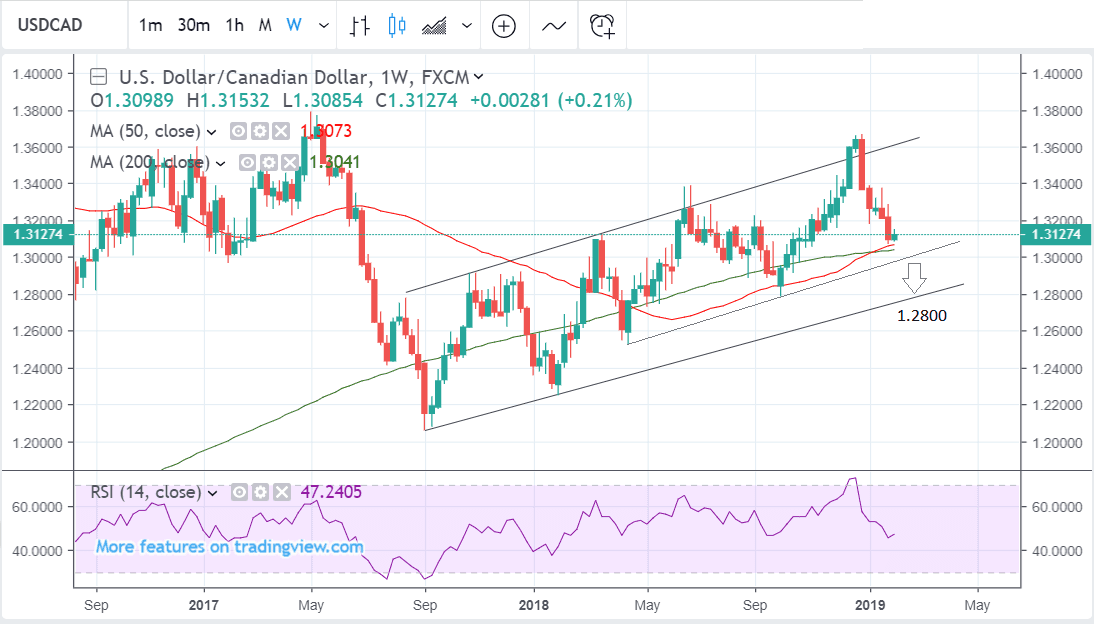
It is also possible to draw the border lines of the ascending channel at slightly different levels joining different peaks and troughs.
The result is a wider channel as shown in the picture below, and this results in a different analytical interpretation.
Drawn like this, the exchange rate would not now be as precariously positioned at the base of the channel, looking so vulnerable to breaking down, as on the previous daily chart.
A lower channel line made from connecting the April and October lows would suggest the pair still had to fall to 1.3000 before finding the base of the channel.
For confirmation of a breakout, it should have to move below the mid or low 1.29s, to the initial target at 1.28.
Yet it would probably fall even further in this interpretation.
Another valid method of finding the downside target would be to take the height of the channel and extrapolate it lower by 61.8%, from the break which in this case generates a target at 1.25.
* Advertisement