The AUD/USD pair has reached a key technical level after rising up to its recent 0.7712 highs.
These highs correspond with the level of a trend-line which connects the April, November (2016) and March 2017 highs.
The higher the number of touches a trend-line has, the stronger and more significant it is, and because this line has been formed by three touches it is in the category of the stronger type.
Commerzbank’s technical analyst, Karen Jones, notes how the level is probably also the top of a market pattern: a triangle formation or channel.
“AUD/USD is at the top of the channel: The market has reached the top of the triangle at 0.7712,” said Jones a briefing dated June 30.
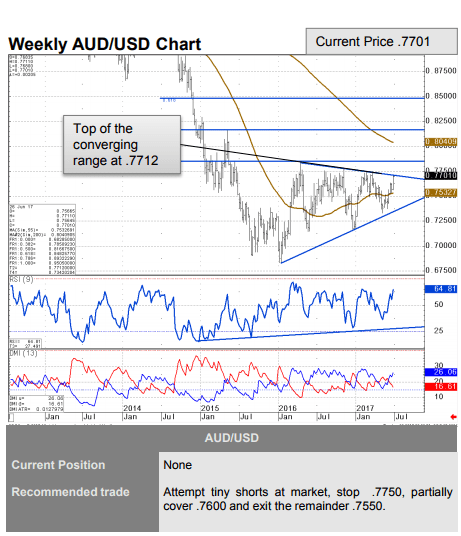
Given the exchange rate has been repelled three times before, expectations are for the same thing to happen again.
“We suspect that this will hold the initial test for a slide back towards the 200-day ma at 0.7530,” said Jones.
Indeed the exchange rate does appear to have backed down from the 0.7712 highs already and is currently trading at about 0.7681.
“However, a move back above the top of the triangle at 0.7712 would trigger a move higher to at least 0.7836/50, the 2016 high,” said Jones.
We actually see the Commerzbank target as quite conservative since a primary method for measuring the extend of gains after a breakout from a channel of triangle is to measure then height of the pattern at its widest part and extrapolate that higher from the point of the break.
Using this method of establishing a target will generate it at 0.8435, however, a more conservative ‘minimum’ is often achieved with a high degree of certainty at the 61.8% of the height, which translates to 0.8190 on AUD/USD.
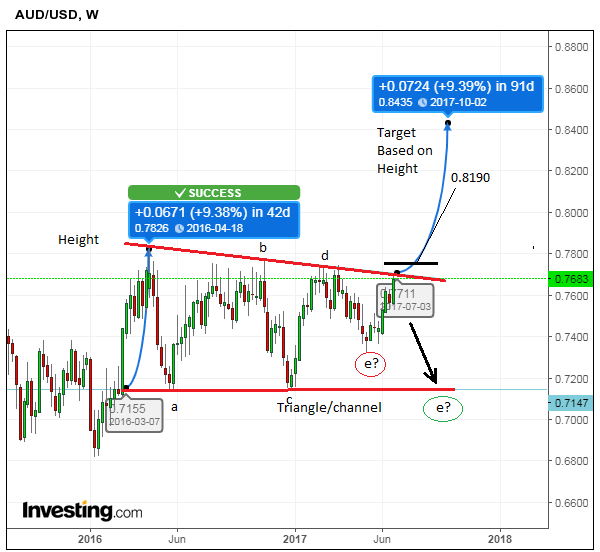
Another issue to consider is whether the triangle has in fact completed or not, as it is not clear that it absolutely has.
Triangles normally have a minimum of 5 composite waves often labelled a,b,c,d,e.
The triangle on AUD/USD has four clear waves but wave-e is debatable.
It is possible ‘e’ has already completed, in which case the end of ‘e’ occurred in the middle of the pattern; this ‘e’ is illustrated below circled in red.
Another possibility is that ‘e’ has not finished yet in which case we must expect a rotation at the current highs to be followed presently by a move back down to the channel/triangle lows at 0.7150; this ‘e’ is distinguished by being circled in green.
Breakouts from channels or triangles are often volatile affairs and one event on the horizon for the pair which could trigger such a forceful, move could be the next meeting of the Reserve Bank of Australia (RBA) next Tuesday, July 4.
Chances are all the more elevated given the current trend towards more hawkish guidance – which means wanting higher interest rates – and the relatively strong performance of the Australian economy relatively speaking , over the last six months, characterised by a steady rise in employment and consumption.