- Major trendline break reverses short-term trend
- Gains now seen potentially to 0.7360
- Easing trade tensions and mid-terms catalysts
It is rare that you will see as clear a trendline break as that which has just occurred on AUD/USD.
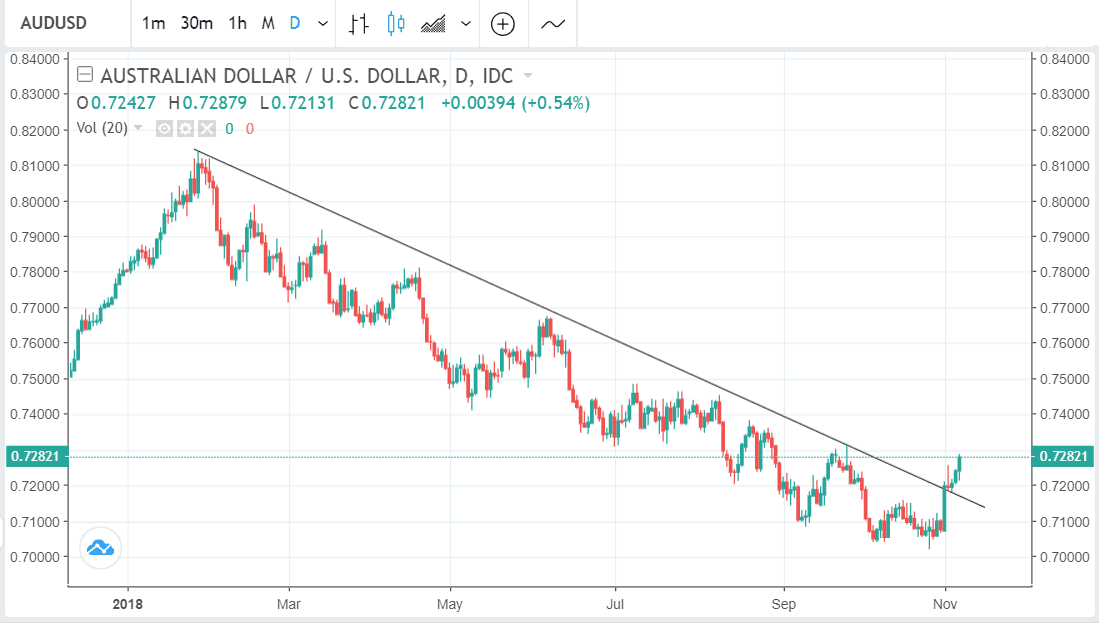
The pair was in a downtrend for all of 2018 which finally appeared to bottom at the October 26 0.7020 lows. Since then it has been tracing out and uneven but steadfast recovery which has risen to the current 0.7280s.
Last Friday the pair crossed a major line in its quest higher after breaking above the trendline for the downtrend since the January highs.
After an initial stutter, it has since followed through higher.
The break of the trendline on a closing basis marks an important turning point for the pair, which is now much more likely to continue rising, especially in the short-term.
From a short-term trading perspective, the bias is now for the Australian Dollar to appreciate rather than depreciate against the US Dollar.
The rally has come about as a result of a combination of factors but the two main drivers have been easing trade war tensions and the Democratic take-over of the house of representatives in the mid-term elections.
The opening up of a dialogue between Washington and Beijing has supplied a boost to the Australian Dollar because it suggests a better outcome for the Chinese economy compared to an all-out trade war, and what is good for China is good for Australia because of their close trade ties.
The mid-terms have further fueled a rally in AUD/USD by weakening the US Dollar because a divided Congress will probably deteriorate the US's fiscal position.
It will make it extremely difficult for Trump to pass more tax cuts or the massive public spending cuts he was planning to help bring down the ballooning budget deficit.
How high can it go?
In classical technical analysis, a break above a trendline generates an upside target for the follow-through which is the same length as the move immediately prior to the trendline break.
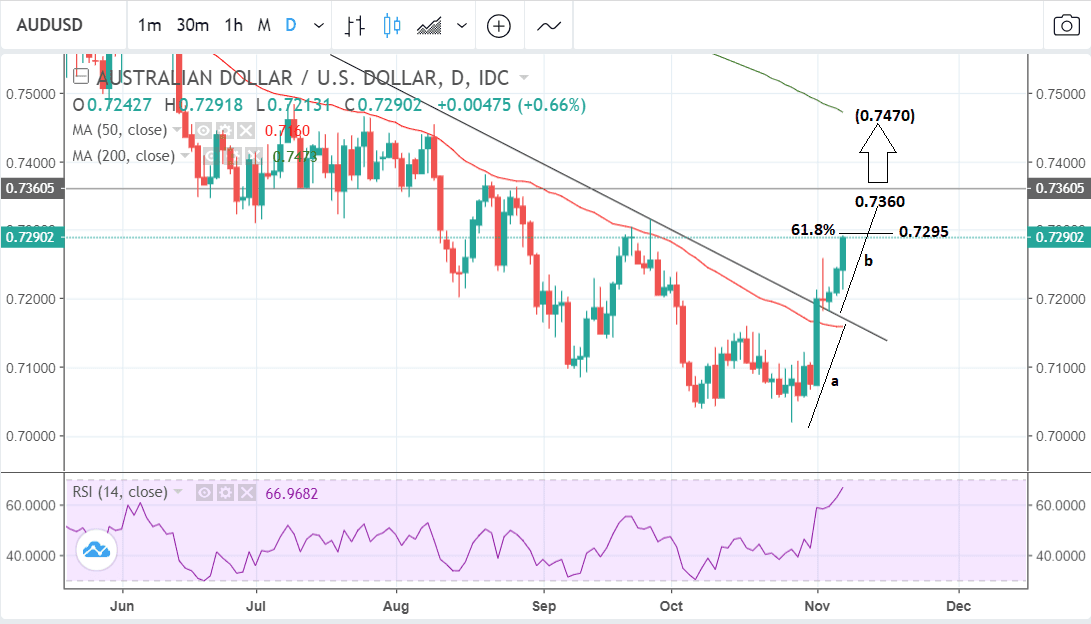
In the chart above the move immediately prior to the break has been labeled 'a' and the move after the break 'b'. The end of 'b' and therefore the eventual target for the current breakout move is at 0.7360.
A more conservative estimate uses 61.8% of the length of the move prior to the break extrapolated higher, which yields an upside target at 0.7295, which is only 5 points above the current spot price.
One indication that the rally could eventually reach its higher more optimistic target at 0.7360 is that momentum, as measured by RSI in the bottom panel, is rising strongly. This indicates bullish confidence and strength.
The RSI is currently at a higher level than it was it in June when the market was trading up in the 0.7670s. The strong bullish momentum further supports a continuation of the young uptrend.
If the pair manages to break above the 0.7360 target level it is even possible it could rally all the way up to the next upside target at the 200-day moving average (MA) at 0.7470.
MAs often act as tough obstacles to the trend preventing upside evolution and after touching the 200-day the pair would be expected to pull-back at least temporarily if not more permanently.
The 0.7315 September highs are an important confirmation level for market bulls because if surpassed they will indicate a bullish pivot swing higher on the monthly chart around the October lows. This is often a strong longer-term trend-change signal for a pair.
Elliot Analysis
An analysis of the longer-term chart using Elliot wave analysis yields a more mixed conclusion.
The pair may have completed a 5th Elliot wave lower over the long-term (since 2011), or more probably be in the process of completing one.
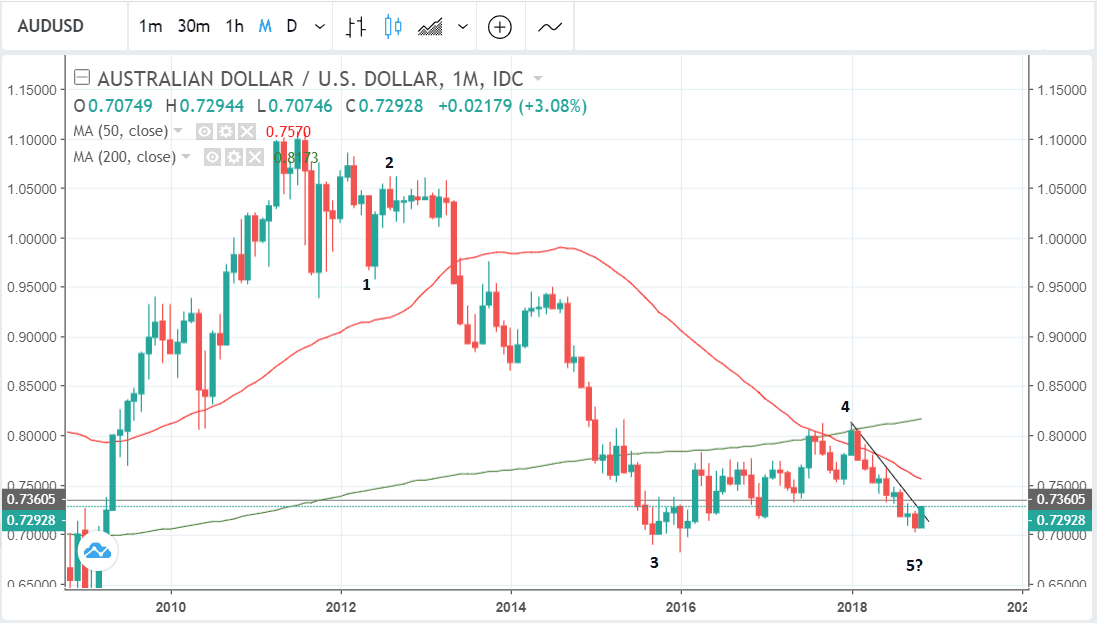
The 5th wave down which probably began at the start of 2018 may now have finished and could lead to a strong recovery as a new up-cycle begins.
Yet there is one missing piece of evidence which would make us more certain the downtrend was reversing, and that is that the pair has not re-touched the level of the wave 3 lows at 0.68 when it bottomed at the October 26 0.72 lows.
Normally wave 5s reach at least as low as 3s and only rarely are they foreshortened. Either this is an anomaly or it raises the prospect that the downtrend may have one final move lower in store, which would take it down to 0.68 one last time before the downtrend is done.
Advertisement
Bank-beating AUD exchange rates: Get up to 5% more foreign exchange by using a specialist provider to get closer to the real market rate and avoid the gaping spreads charged by your bank when providing currency. Learn more here