- ZAR outperforms developed and emerging market FX Monday.
- As oil prices soften, support trade balance in balm for economy.
-January's lows offer support as highs keep USD/ZAR contained.

© Lefteris Papaulakis, Adobe Images
- GBP/ZAR spot rate at time of writing: 20.71
- Bank transfer rate (indicative guide): 19.92-20.06
- FX specialist providers (indicative guide): 20.33-20.50
- More information on FX specialist rates here
- Set an exchange rate alert, here
The Rand edged lower against the Dollar, Pound and Yen on Monday but had strong technical support around its January lows on the charts, while the South African unit otherwise outperformed all major developed and emerging market rival in price action that belied widespread strength in U.S. exchange rates.
South Africa's Rand was down a mere fraction against the U.S. Dollar, British Pound and Japanese Yen on Monday alongside the recently troubled Brazilian Real and in contrast to outcomes for currencies in emerging Europe and parts of Asia, as well as the oil-linked currencies like the Russian Rouble.
"This Monday has started on a good note if you are in any way impacted by the blockage of the Ever Given in the Suez Canal, with news headlines suggesting the ship has been partially refloated," says Siobhan Redford, an economist at Rand Merchant Bank. "Another positive is that the oil price has reacted."
The Rand entered the new week on its front foot after progress was made in efforst to remove a beached container ship from an important shipping lane in the Suez Canal, leading a week's worth of hot air to escape from oil markets and prices, although declines in major crude benchmarks are tentative.
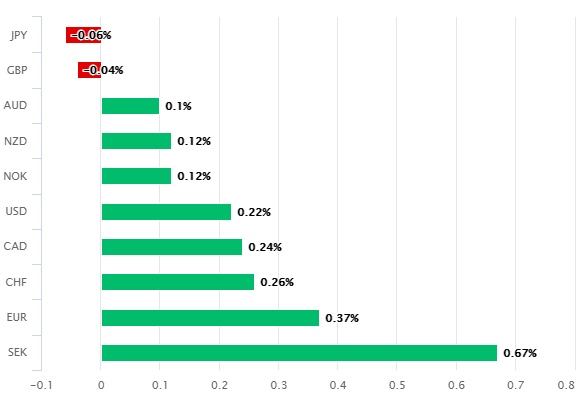
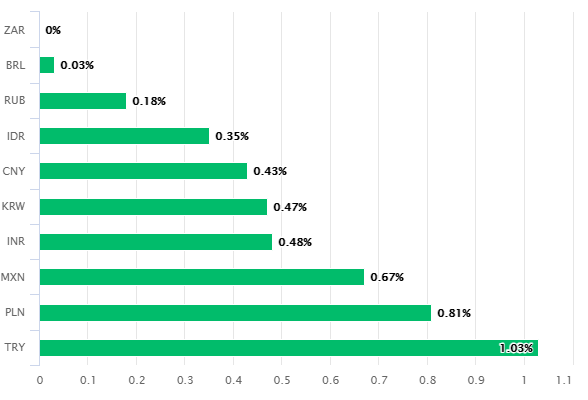
Above: South African Rand performances on Monday. Source: Pound Sterling Live.
Earlier double-digit gains for oil prices were cited last week as having had a negative impact on South Africa's goods trade balance while oil price increases of any kind are always an inflationary influence on the economy and for both reasons combined are rarely welcomed in South Africa.
This means two-way risks for the Rand in the week ahead in light of Thursday's Organization of Petroleum Exporting Countries (OPEC+) meeting, which could lift prices if recent volatility leads the cartel to eschew another increase in daily production.
The economic data calendar is devoid of market-significant data for the Rand this week although South Africans will be waiting with baited breath to hear if President Cyril Ramaphosa and his cabinet will tighten restrictions on social contact ahead of the Easter break which could see religious gatherings disrupted and alcohol sales prohibited.
However, and interim the South African currency is likely to be sensitive to developments in U.S. Dollar exchange rates and most notably Euro-Dollar.
Euro-Dollar was stabilising on Monday, which is supportive of the Rand, after finding support on a Fibonacci retracement level last week and with Europe's single currency depreciating instead through declines in EUR/GBP; one of the four corners of the trade-weighted Euro.
The Rand is likely to continue to find support near its January 2021 lows in the weeks ahead, according to technical analysts at Commerzbank, who flag 15.6645 as a likely ceiling for USD/ZAR in the weeks ahead. They say that if and when USD/ZAR makes it beneath February's low around 14.3952 - which is also the location of the Rand's 55-month moving-average - there wouldn't be much by way of technical obstacles keeping USD/ZAR from lows last seen in early 2020 and 2019 before then.
"USD/ZAR’s failure slightly below the January high at 15.6645, at the current March high at 15.5716, led it to oscillate around the 55 day moving average at 14.9476 while remaining above the December-to-February lows at 14.5044/14.3952," writes Axel Rudolph, a senior technical analyst at Commerzbank in a Monday note. "Resistance can be spotted at the 15.1916 late February high and along the 2020-2021 resistance line at 15.3306."
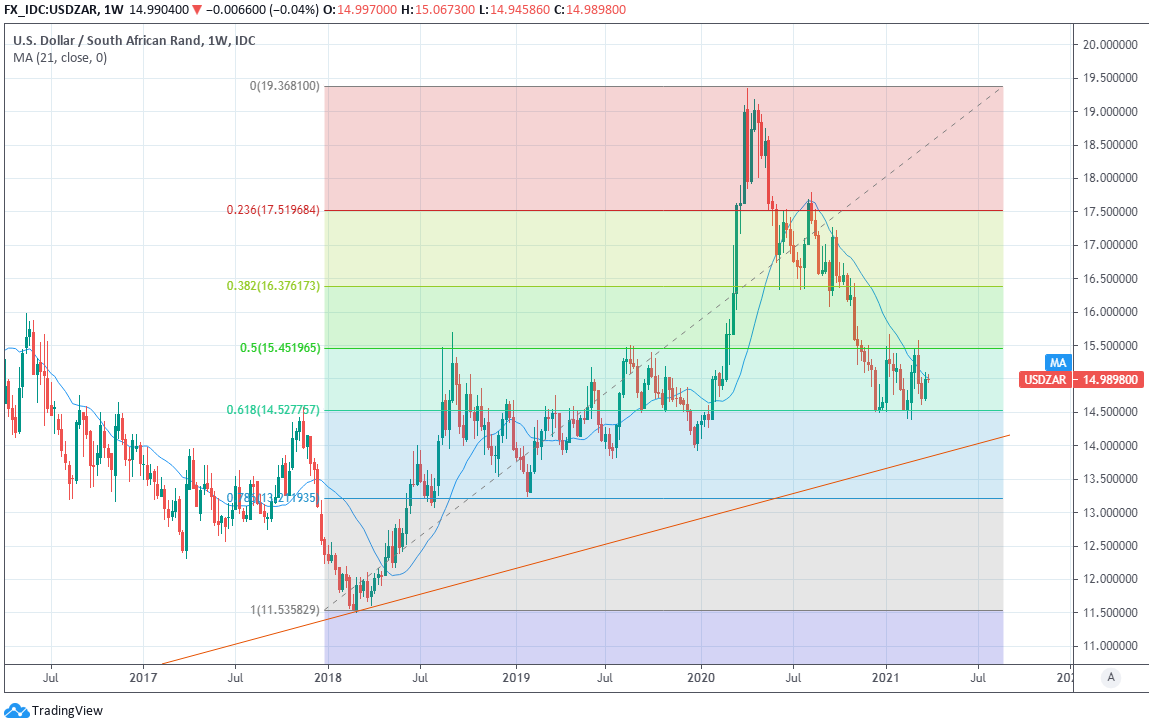
Above: USD/ZAR at weekly intervals with 21-week average (blue), Fibonacci retracements of 2020 rally and 2011 trendline.