- GBP/USD has fallen to key support and plateaued
- The pair may be building for a recovery after touching 1.3300
- A persuasive sell-signal, though, may act as a spoiler
GBP/USD has now fallen to levels where analysts are starting to make bullish calls again.
The pair has fallen rapidly and steeply over previous weeks from a peak of 1.4376 in April to the recent 1.3204 lows, but the rapid decline stalled on May 29 and since then has been plateauing - is this the start of a recovery as some analysts think, or is the pair simply taking a 'breather' before pitching lower?
Whilst daily momentum is not indicating a clear bias, either way, the stochastics indicator is now in oversold territory tentatively indicating the possibility of a reversal, says Saktiandi Supaat, head of FX research at Maybank.
In addition the "price pattern suggests a potential falling wedge in the making – typically associated with a bullish reversal," says Supaat.
"Rebound can target 1.3360, 1.3410. An extension towards 1.3460 should not be ruled out," he adds.
Supaat also notes "attractive" support levels seen at 1.3220, 1.3150, which are likely to put a 'marble floor' under further losses.
The pair has fallen to the midpoint of the previous rally, also known as the 0.50% fib (Fibonacci) retracement, notes Citibank in a recent analysis of the exchange rate. This fibonacci point tends to be a common reversal level for corrections, yet Citi are cautious about forecasting a bullish reversal yet, saying that despite being undervalued more losses to 1.31 are probable.
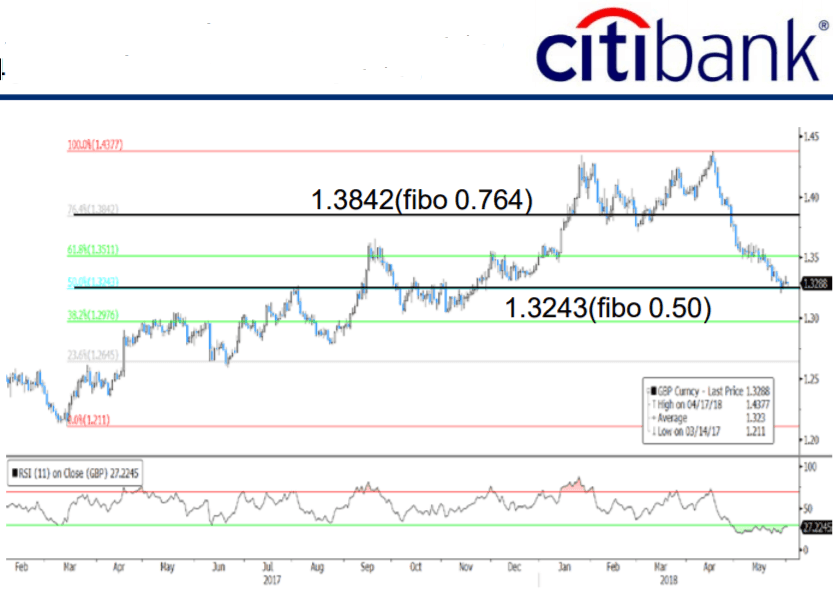
(Image courtesy of Citibank)
"GBP remains cheap with its REER close to all-time lows. That said, There is no reason why it can’t get cheaper," says an analysis from Citi.
They say the pair confirmed a double top pattern with a downside target at 1.31, reachable within the next 3 months, but after that, they forecast a rebound to 1.39.
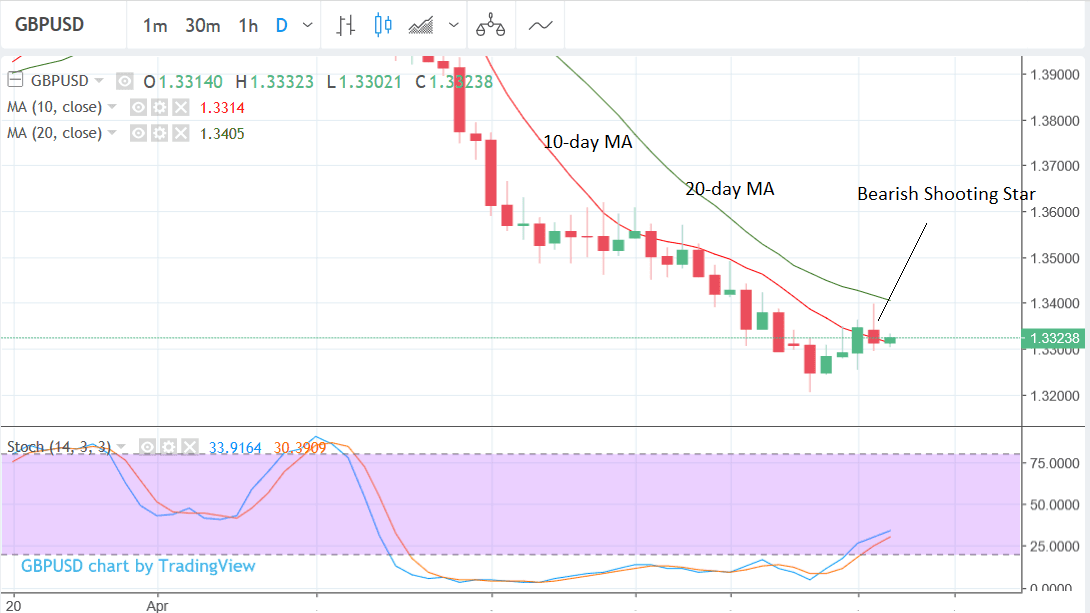
Indeed, Bulls may be forced to think twice before launching their longs by a bearish set-up on the daily chart, which is showing the pair forming a bearish shooting star candlestick in the sell-zone between the 10-20 moving average. This sort of set-up is a fairly reliable indicator of more downside to come.
Advertisement
Get up to 5% more foreign exchange by using a specialist provider to get closer to the real market rate and avoid the gaping spreads charged by your bank when providing currency. Learn more here.