
The Pound-to-Dollar may have lost ground in December but looking at the bigger picture reveals potential for more upside; and it's not just us, other analysts agree.
GBP/USD has broken above a major multi-month trendline drawn from the 2014 highs that is clearly visible on the monthly chart below.
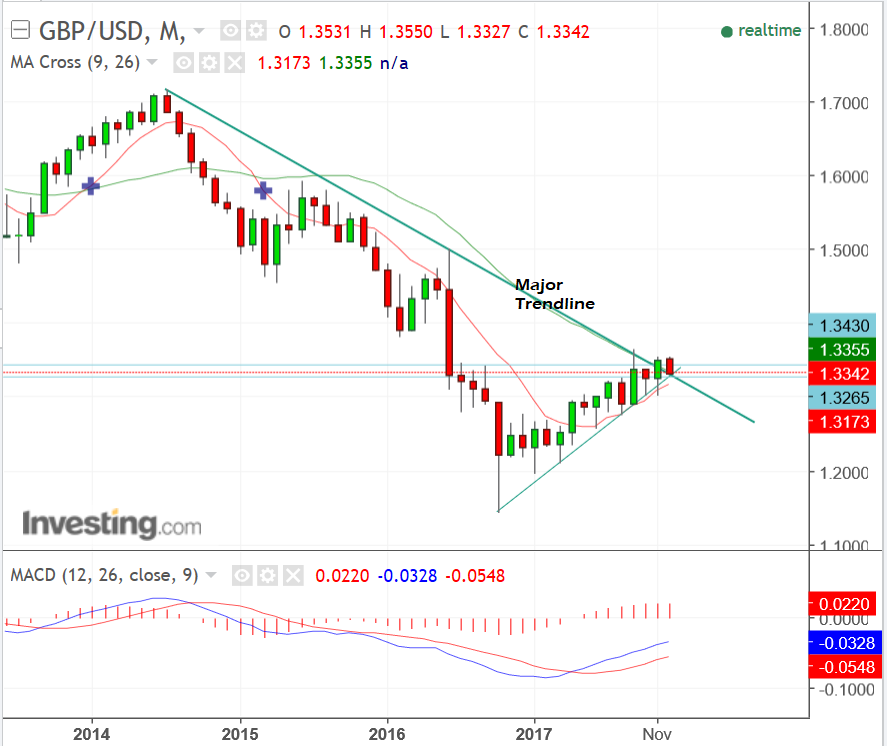
This is an important turning point for the pair, indicating that the down-trend is no longer as dominant as it was.
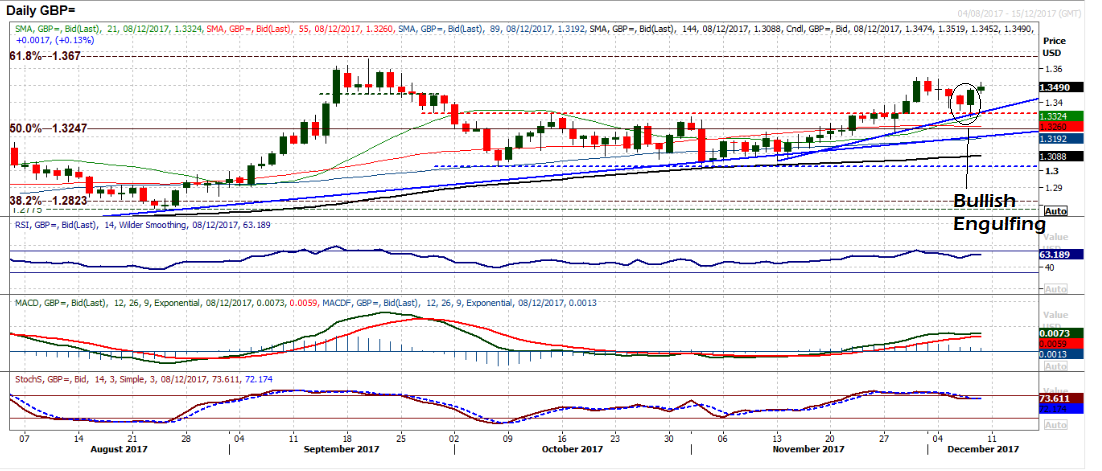
We can see the break above the trendline in more detail on the daily chart below. This shows the pair breaking higher, before peaking in the mid 1.35s on December 01 and then pulling back to its current level in the 1.33 area.
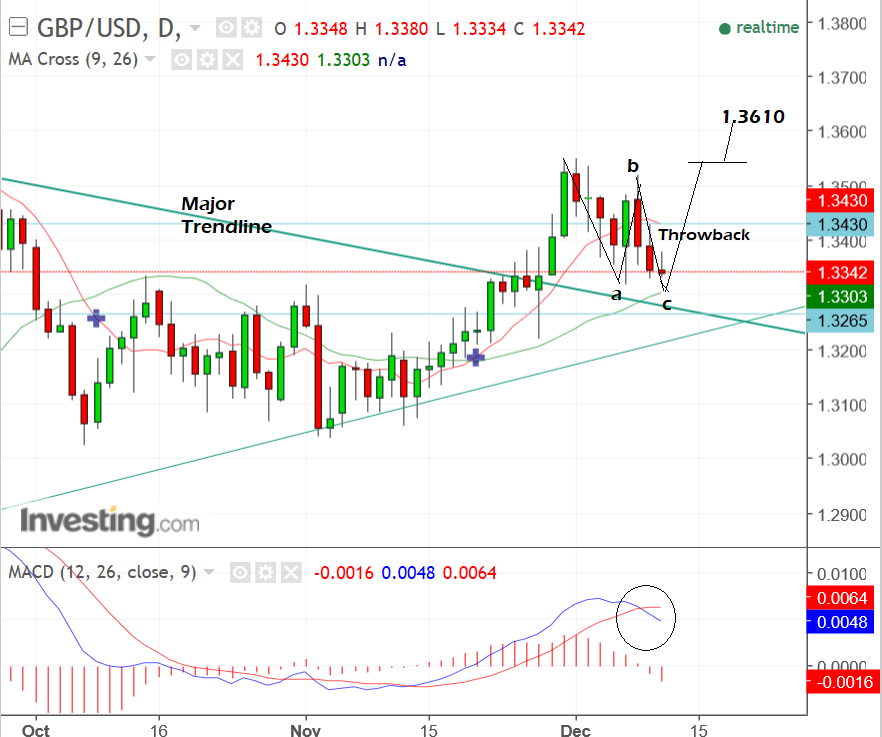
The downward move, after the initial break above the trendline, could be what technical analysts call a 'throwback'.
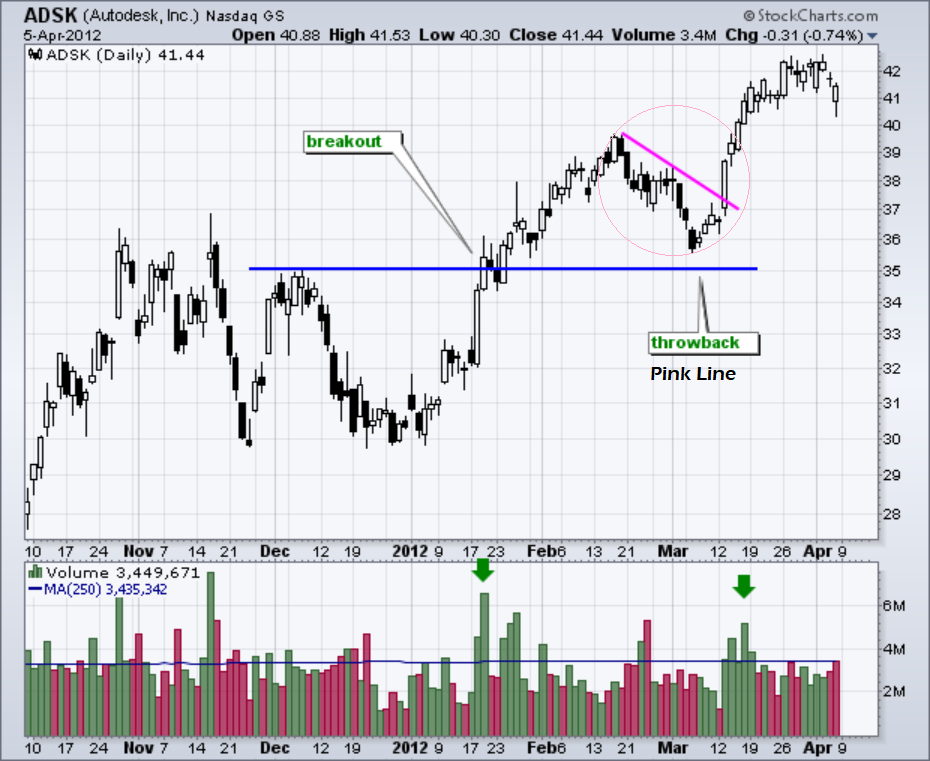
This occurs after major trendlines, or other significant chart levels, are broken. It consists of a temporary pull-back to the line that has just been breached (see below), before the pair then sets off again in the direction of the breakout.
If the pull-back from the post-trendline breakout of the 1.35 highs is, as we suspect, a throwback, then the next move is likely to be back up in the direction of the earlier break.
First, however, the throwback may have a little bit lower to go before it completes. The rate could move down to 1.3300 before resuming its push higher, back up to 1.3550.
A break above the December 01 high will confirm a continuation oward to the next target at 1.3610, where the R2 monthly pivot is situated.
R2 is likely to prove a formidable glass ceiling, above which it could be difficult for the exchange rate to break.
Many technical traders expect a pull-back when prices reach their monthly pivot points and sometimes trade the possibility with short-term bearish bets.
This tends to increase selling at the pivot, leading to lower prices and, essentially, making the pull-back a 'self-fulfilling prophecy'.
The pull-back from the December 01 highs could also be classed as a possible a-b-c correction, which further suggests more upside to come, once the correction has completed.
The MACD momentum indicator in the bottom frame is actually looking pretty bearish, which doesn't fit with the rest of our broadly bullish analysis, but it may suggest any resumption of the uptrend could take some time to evolve.
Alternative Perspectives
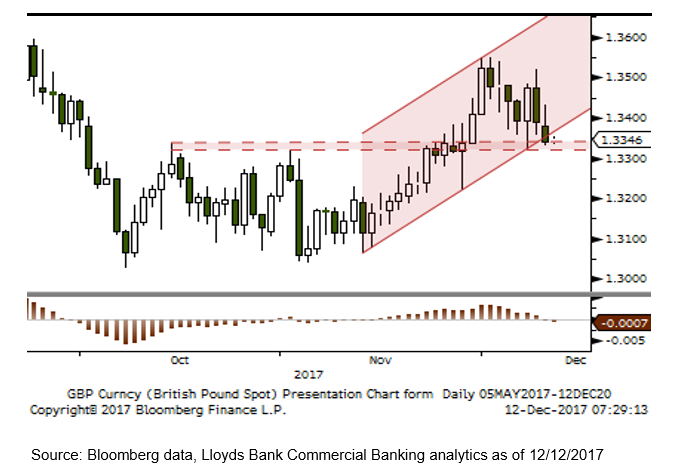
Robin Wilkin, a strategist at Lloyds Banking Group, contributes to the throwback hypothesis except rather than highlighting the major trendline, he focuses on a major support level at the current market level around 1.3300, composed of the two October highs (see chart below).
"While this level holds there is still potential for a move back to 1.3550 and then 1.36-1.39 key medium-term resistance," says Wilkin.
Support levels are key zones on charts which tend to draw more buying and selling. They often occur at previous major highs or lows, as well as at trendlines and major pivots. Buying and selling, at and between these levels, leads to the development of ranges.
A more bullish view is expressed by Karen Jones, a technical analyst at Commerzbank, who, like us, draws attention to the bullish potential for a break above the major 2014 trendline.
"It [GBPUSD] has recently broken above the 2014-2017 downtrend and this has introduced scope to the 1.3658/71 September high and double Fibonacci retracement."
Jones also flags further scope for upside, based on insights drawn from her Elliot Wave analysis, which is indicating that the current 'cycle' higher has further to go.
Richard Perry, an analyst at retail broker Hantec Markets, is particularly bullish. He points out that Pound-to-Dollar has pulled back to a substantial band of support levels that are likely to underpin the pair in the early 1.33s. These could form a 'launch pad' for a move higher.
"The corrective slip of the past few days seems to have been settled and reversed, interestingly around the old breakout support at $1.3335 (yesterday’s low was $1.3318) and also the support of what is coming up to be a four-week uptrend," says Perry.
The "bullish engulfing" Japanese candlestick pattern on the daily chart, which happens when the body of the day (the difference between open and close) is particularly wide, is in the opposite direction to the trend and engulfs the whole of the previous day's body.
Get up to 5% more foreign exchange by using a specialist provider by getting closer to the real market rate and avoid the gaping spreads charged by your bank for international payments. Learn more here.