
Image © Adobe Images
- GBP/INR starting new uptrend higher
- Possibility of a break back above neckline
- Rupee to be driven by risk trends and CPI data
The Pound-to-Rupee exchange rate is trading at around 86.05 at the time of rising, after rising 0.86% at the start of the week, and studies of the charts suggest more upside may be on the horizon due to the break above the July highs.
The 4hr chart - used to determine the short-term outlook, which includes the coming week or next 5 days - shows the pair having undergone a strong recovery after basing at the July 30 lows.
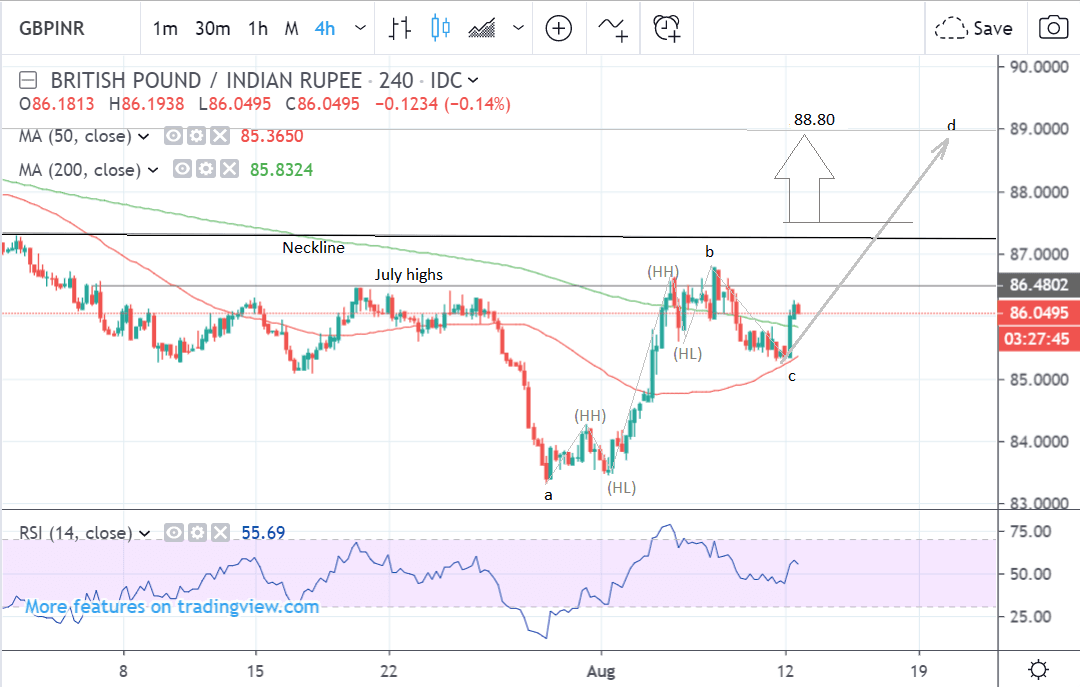
The strong recovery has now resulted in a break above the July highs which is a bullish sign.
The pair has also established a new sequence of peaks (higher highs ‘HH’) and troughs ( lower highs ‘LH’) on the 4 hour chart which further suggests there is a case for GBP/INR having reversed trend higher.
It is possible the pair is actually in the process of unfolding a measured move pattern higher, which is a common market pattern in the shape of a zig-zag, in which the first and third waves are of a similar length.
If this is the case then judging from the length of a-b, c-d - which has yet to unfold - should rise up to an upside target at around 88.80.
This would also mean a break back above the neckline of a large head and shoulders (H&S) pattern observable on the weekly chart.
A successful break above the neckline would indeed by a bullish sign for the pair since a break below is the trigger sign for the breakdown in the H&S pattern, so it is a significant market level.
The daily chart shows the pair having risen up and stalled at the level of the 50-day moving average (MA). The MA could be a tough level to crack and may provide a ceiling for the pair.
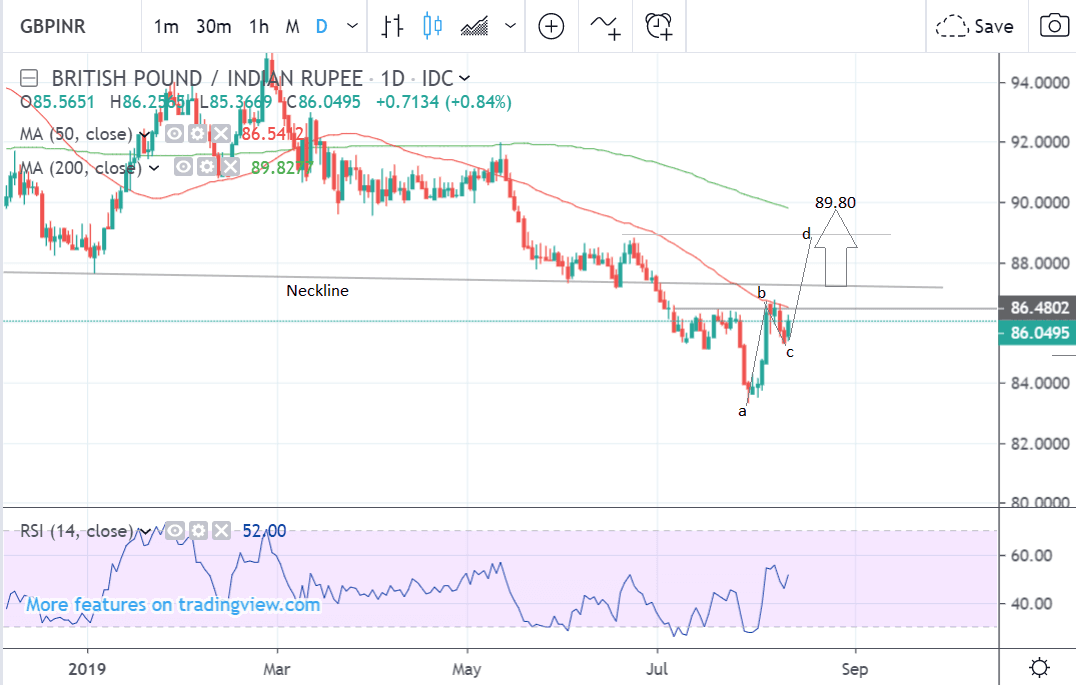
We have drawn on the measured move discussed above and also extended the medium-term target to the level of the 200-day moving average (MA) at 89.80.
Major MAs often form strong support and resistance levels so the exchange rate is forecast to stall when it reaches the level of the 200-day.
The daily chart is used to give us an indication of the outlook for the medium-term, defined as the next week to a month ahead.
The weekly chart - used to give us an indication of the outlook for the long-term, defined as the next few months - shows how a bearish H&S topping pattern has formed.
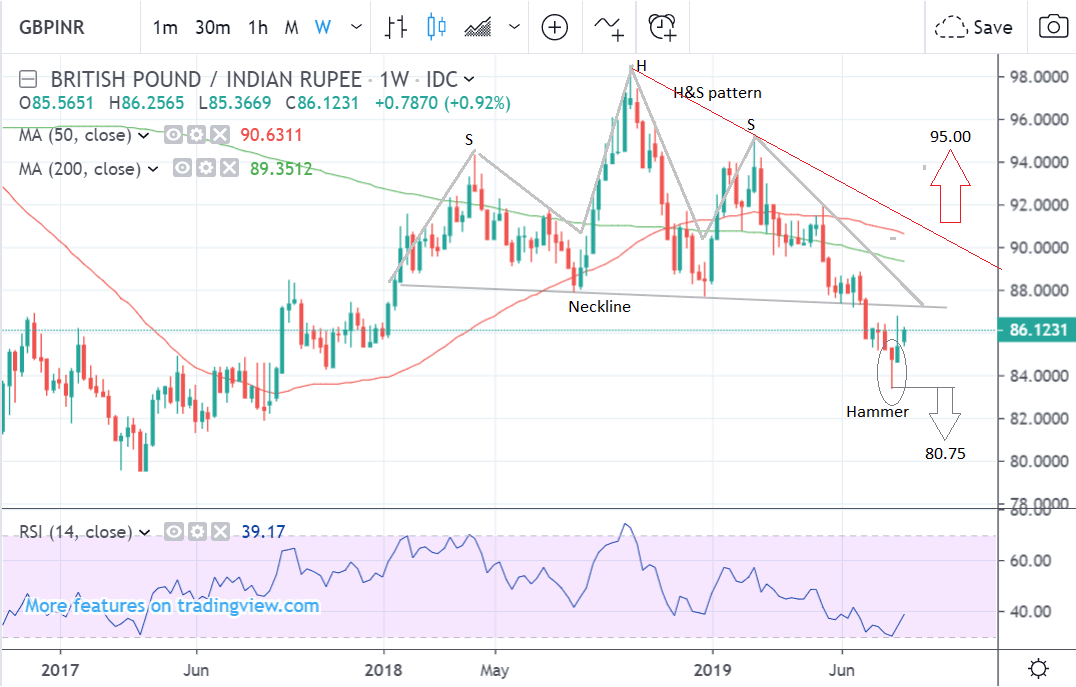
The H&S is composed of three peaks - a head and two shoulders. It has broken below the neckline, confirming a decline as deep as the pattern is tall.
This suggests an eventual conservative downside target at 80.75, however, the reversal on the lower time frames, means the pair may be in the process of establishing a new bullish uptrend.
For the negative implications of the H&S to be negated we would need to see a break above a red trendline drawn connecting the head and the top of the right shoulder. A break above that line at roughly 90.00 would signal a longer-term reversal higher.
Until it is broken, however, there is still the risk of more downside to the 80.75 target, which has not yet been fulfilled, and a break below the 83.32 lows would give the green light to a continuation down to that target.
The bullish hammer candlestick formed at the July 30 lows is a bullish indicator supporting a reversal of the trend higher.
Time to move your money? Get 3-5% more currency than your bank would offer by using the services of foreign exchange specialists at RationalFX. A specialist broker can deliver you an exchange rate closer to the real market rate, thereby saving you substantial quantities of currency. Find out more here.
* Advertisement