The British pound has steadily gained against the Canadian Dollar over recent months - we look at the various timeframes to determine whether this move can continue.

The bad news for those hoping for an ever better GBPCAD exchange rate is that a growing chorus of bank analysts are calling a recovery in the Canadian Dollar in 2016.
Prominent amongst these thinkers is HSBC’s David Bloom who in early December reasoned the outlook for CAD had improved after the new Canadian government promised an end to austerity and a programme of fiscal stimulus.
Then Moody’s upgraded their outlook for Canadian Covered Bonds on the back of an improved economic outlook.
Now most recently SocGen’s Kit Juckes has also been talking up the loonie, saying in a note today that:
“Toronto ended 2015 as the cheapest city in which I bought a Tall Latte.
“It was the worst performer of the G10 currencies and for good reason - the falling oil price hit the economy hard.
“However, even if oil remains under pressure the current valuation is extreme and in due course, as North American production is slowly reined-in, supply and demand will fall back in line and oil prices stabilise/recover somewhat.
"Then CAD will rally.”
Much hinges on oil stabilising, as Juckes goes on to admit:
“Buying CAD is a bet that it has now fallen as much as it can on the back of oil prices, and to a lesser degree, that oil prices will not fall ‘much' further even if they don't bounce any time soon.”
Latest Pound / Canadian Dollar Exchange Rates
  | Live: 1.8878▼ -0.08%12 Month Best:1.9044 |
*Your Bank's Retail Rate
| 1.8236 - 1.8312 |
**Independent Specialist | 1.8614 - 1.8689 Find out why this is a better rate |
* Bank rates according to latest IMTI data.
** RationalFX dealing desk quotation.
The Trend is Your Friend
The long-term chart of pound to Canada shows the pair in an up-trend as the loonie has successively devalued with each move lower in oil prices.
Technical analysts don’t presume the trend has ended until there is sufficient proof of a turnaround and as yet not such proof exists on the monthly chart.
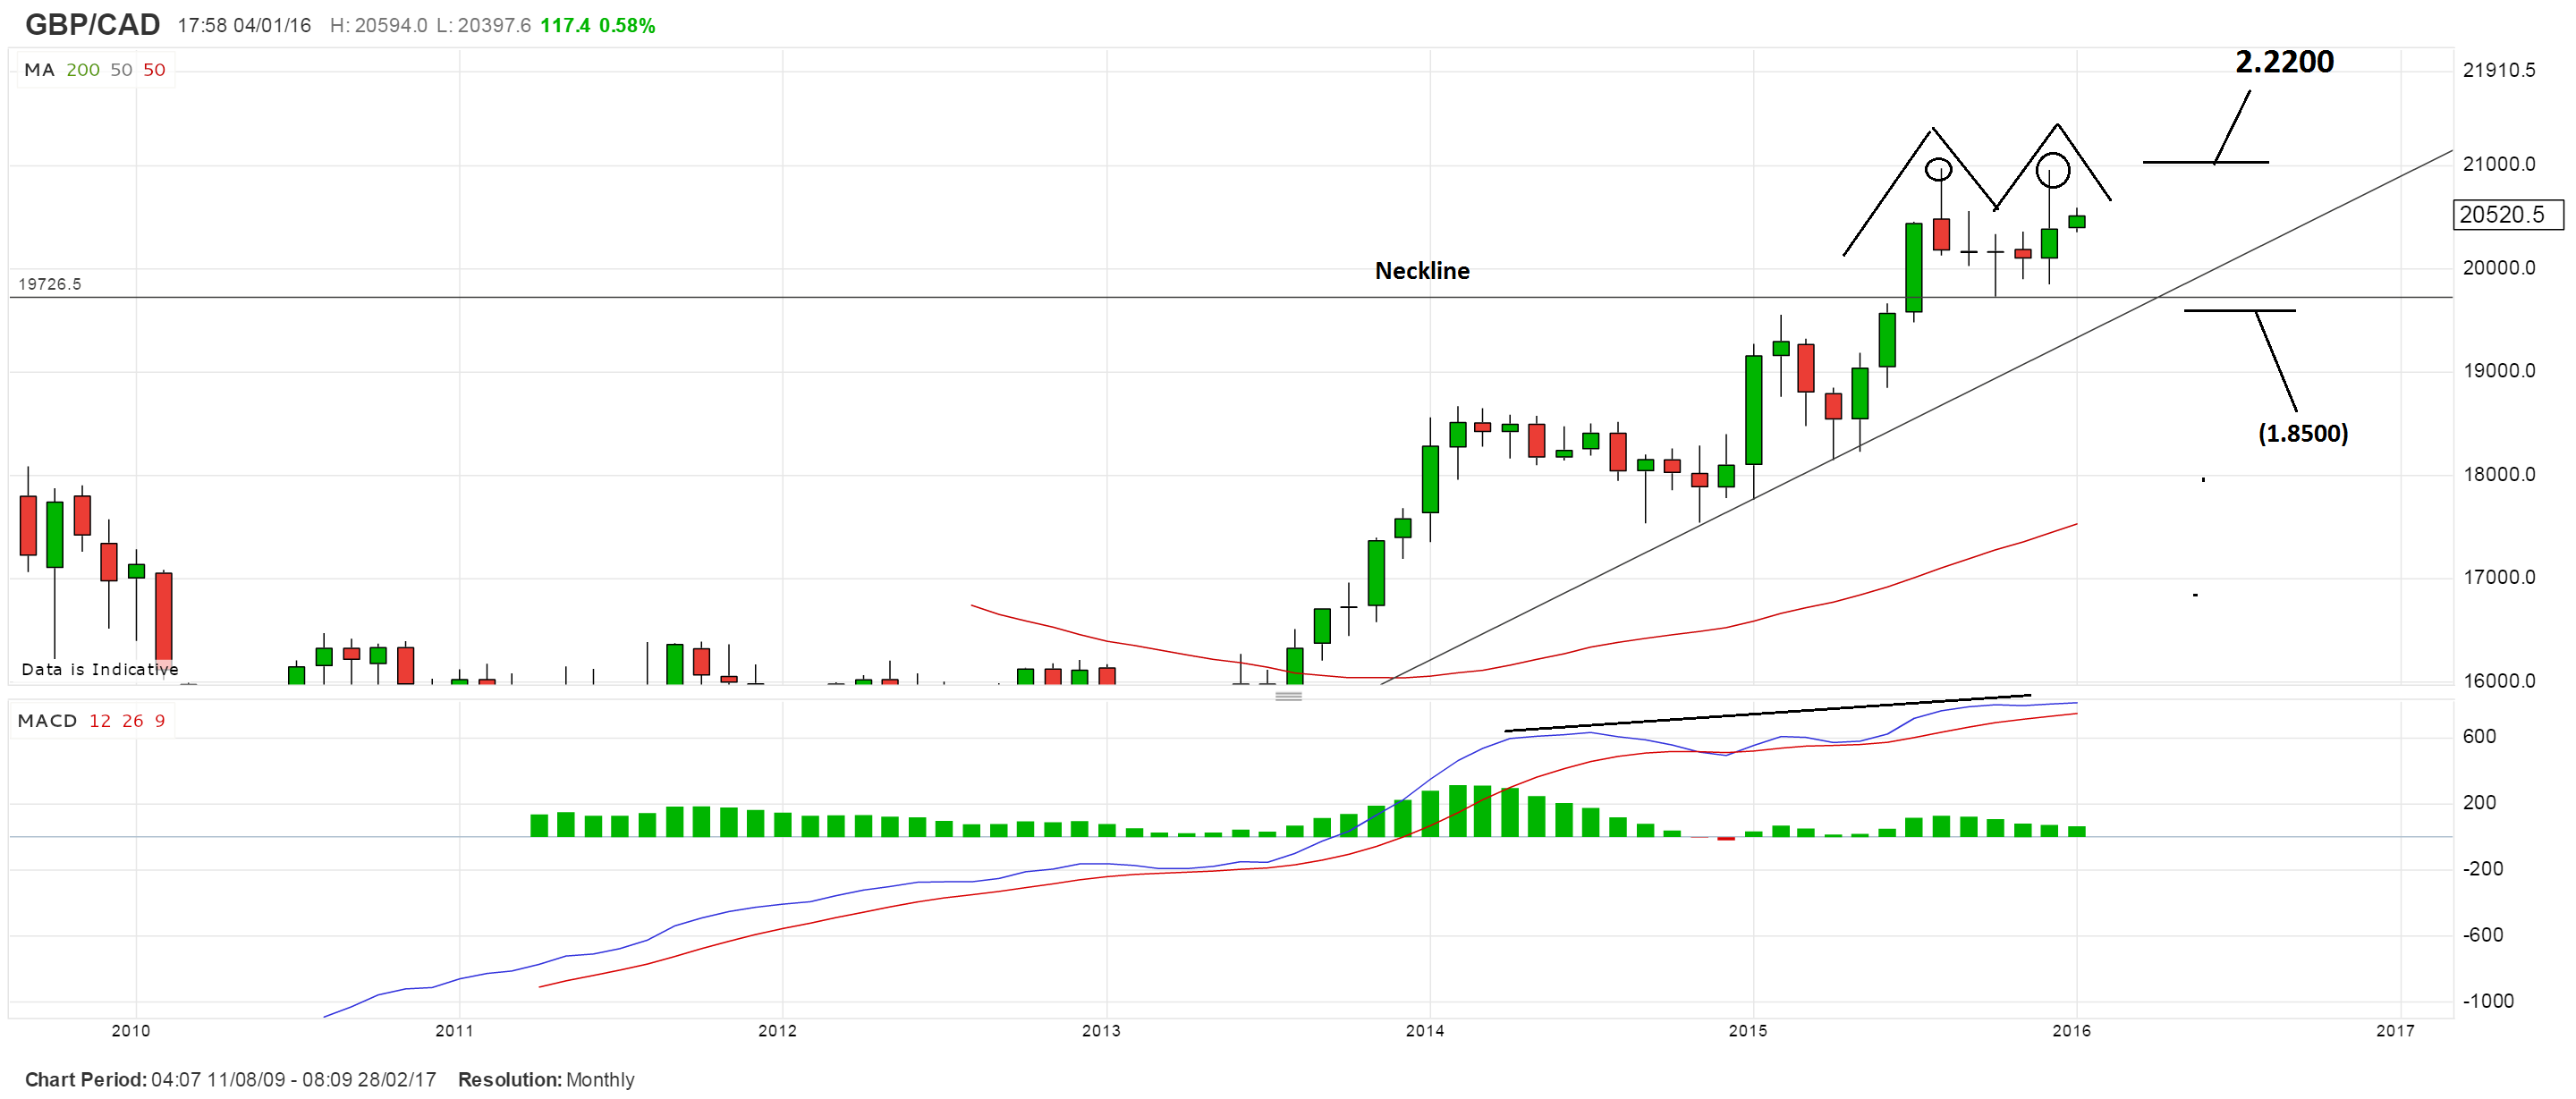
The only significant bearish sign is the small double top made up of the August and December ’15 highs.
In both months the exchange rate moved higher and touched 2,0975 and 2,0960 respectively before moving back down and forming a shooting star type candle.
However, volume is not confirming the bearish reversal pattern as it is showing higher volume on the right-top when it should be showing weaker volume.
Momentum as measured by MACD is also failing to show weakness in the right-top- as it would in a classic double top.
Therefore the significance of the pattern is diminished.
Nevertheless, a breach of the neckline at 1.9700, would still be a bearish sign and lead to a probable move down to a target at 1.9293 initially, followed by 1.8500 eventually.
Further upside, remains the more probable outcome, however, from a purely technical view; and a move above the highs as well as the R1 monthly pivot – so above 2.1050 – would probably lead to a move higher, first to 2.1511, followed by 2.2200 eventually.
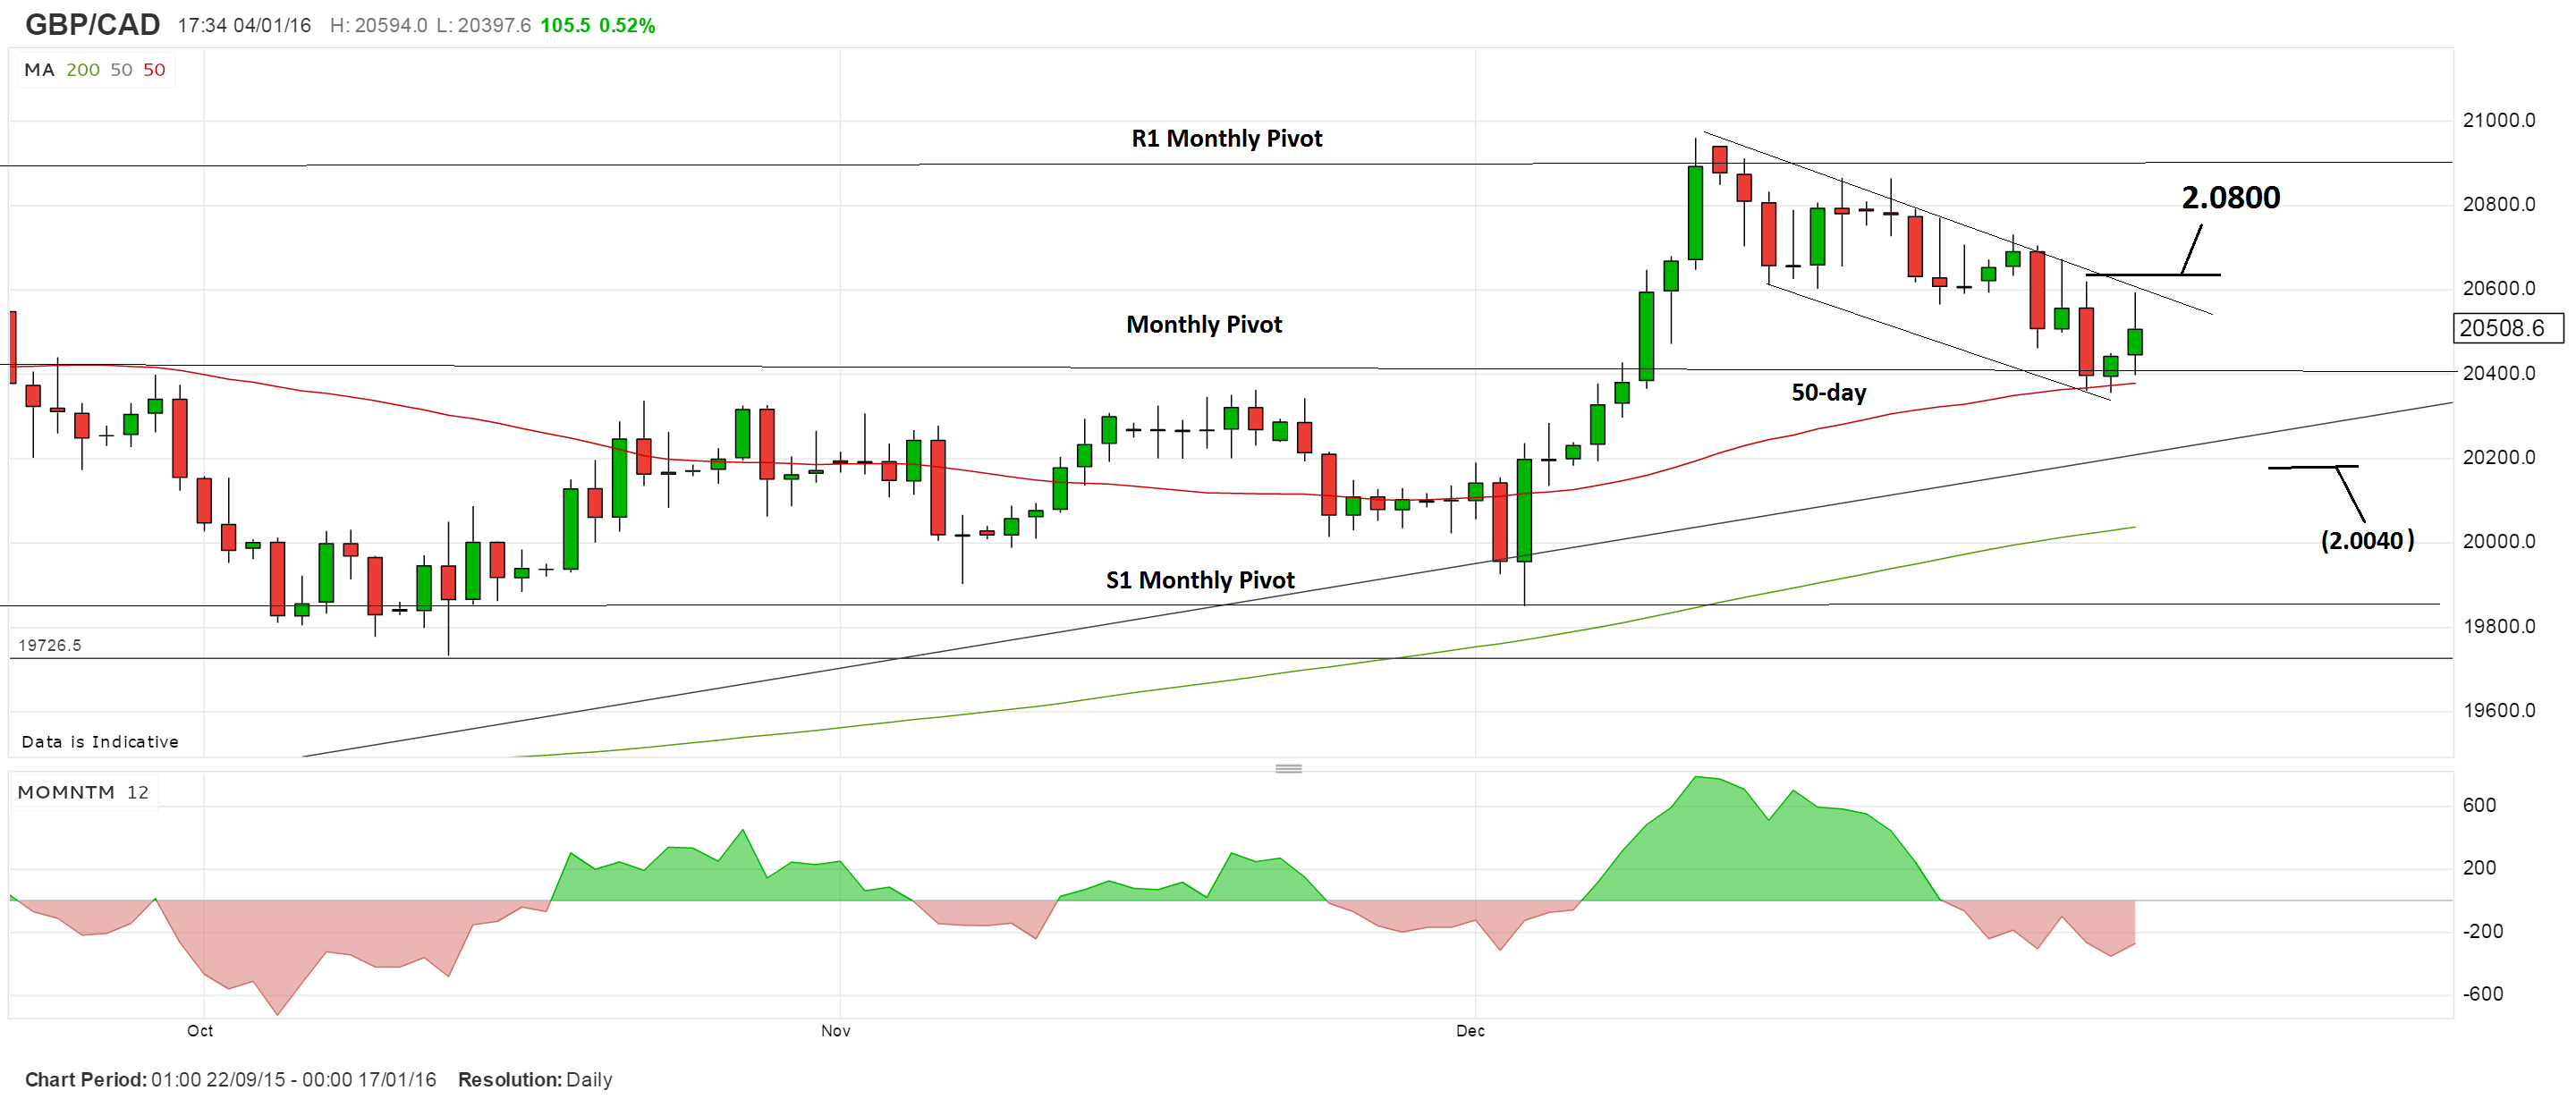
Daily Chart View
On the daily chart we see a flag-like pattern which has formed following the brief early December peak.
This flag forecasts more upside because it’s a continuation pattern.
Therefore, a break out of the flag – or the descending channel - signalled by a move above 2.0675 would probably confirm a breakout higher, with a target at 2.0800 calculated by extrapolating the width of the channel higher.
Downside is impeded by many layers of support, however, a clear move below 2.0190 would probably confirm a breakdown to the key psychological 2.0000 level.