
Image © Adobe Images
- GBP/AUD recovers in June
- But conviction in the recovery starts to fade
- Studies suggest bias for resumption of downtrend
- Shape of candles, MAs and weekly chart bearish
The Pound-to-Australian Dollar rate has recovered strongly over the last week and has risen for five days in a row that has seen Sterling advance 0.85% to trade at the current 1.8345.
The recovery comes after a sustained run of losses over the course of May which saw the exchange rate decline from a high of 1.8881 down to 1.8126.
The question is can the June recovery survive, or is destined to run out of steam?
Based on an analysis of the charts we think the latter is more likely, and see risks tilted to the downside for various technical reasons.
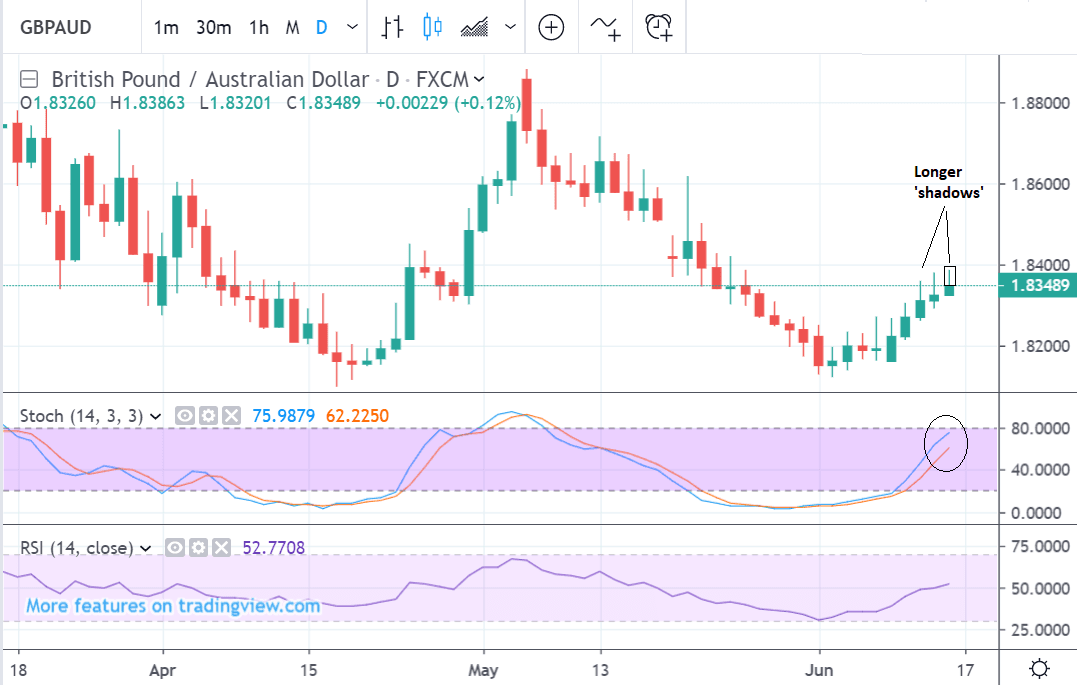
The first of these reasons is that the shape of the candles, which have become more ‘bottom-heavy’ over recent days with short bodies (the body is the distance between the open and close) but long ranges.
They have long ‘shadows’ which is the part of the day’s trading range which sticks out as a thin line above the open and close.
This reflects that despite bullish traders bidding up prices to high peak during the day these peaks are unsustainable, and prices end up falling to close at a similar level to where they opened. This means the gains are only temporary, and when this keeps happening day after day it is a negative sign.
Another bearish sign is the stochastic momentum indicator which appears to be rising up towards overbought zone and peaking. If it enters, reverses, and then exits the overbought zone, above 80, it will be a bearish indicator.
Note how the stochastic accurately forewarned of reversals in the trend at the last three major turns - the June 3 low, the May 6 high and the April 17 low.
This suggests it is in sync with the current cycle and more likely to accurately signal the next market turn.

The 50-day moving average (MA) at the 1.8365 level of the recent highs has capped upside progress and will probably continue to. It is likely to be a tough barrier to progress higher.
Also note how it has successfully thwarted bulls in the past, as circled in red, the inference being that it could do so again the next time.
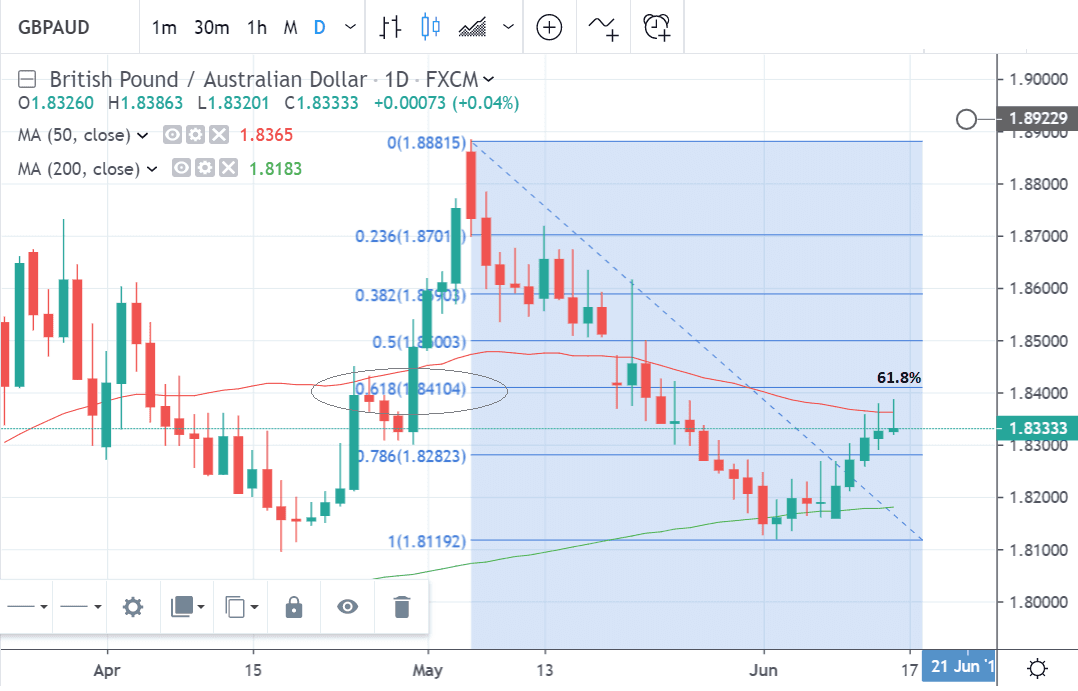
The 61.8% Fibonacci retracement of the downtrend from the May 6 high is also likely to present resistance to further upside.
Prices have been found to respect retracement levels from preceding moves, specifically situated at 78.6%, 61.8%, 50% and 36.8% of the preceding move. The most important is actually 61.8% or the ‘golden ratio’ which is related to forms in nature and financial markets.
These percentage levels are based on the Fibonacci sequence, a mathematical law about how numbers added together in a sequence are related to each other by the golden ratio.
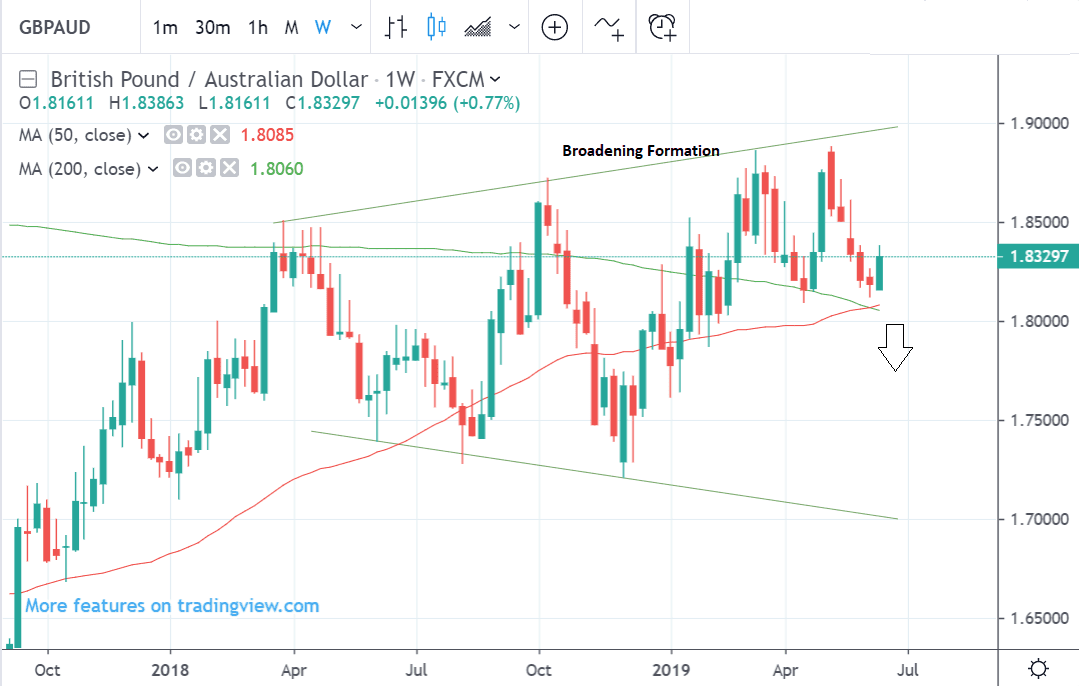
The long-term weekly chart is also bearish as it shows a chart pattern forming called a broadening formation, which indicates lower prices when wave E descends to its final target at around 1.70.
The 50 and 200 week MAs, which are the most significant, are presenting a floor of support in the 1.80s just below the May lows and these are likely to be tough to break below.
A break on a closing basis below 1.80 would be required to confirm the continuation lower.
Time to move your money? Get 3-5% more currency than your bank would offer by using the services of foreign exchange specialists at RationalFX. A specialist broker can deliver you an exchange rate closer to the real market rate, thereby saving you substantial quantities of currency. Find out more here.
* Advertisement