Image © Adobe Images
The GBP/USD chart continues to print higher highs and higher lows, so the trend is yet to reverse completely despite the reversal from the 1.35 handle over the past few days.
With bullish momentum starting to fade, and the absence of strong upside follow-through suggests bullish conviction may be weakening.
This is especially the case as price has recently pushed into a long-term resistance band spanning roughly 1.35 to 1.40 area.
It’s still premature to call a major top, but failure to hold above the 1.35 handle may be a sign for concern.
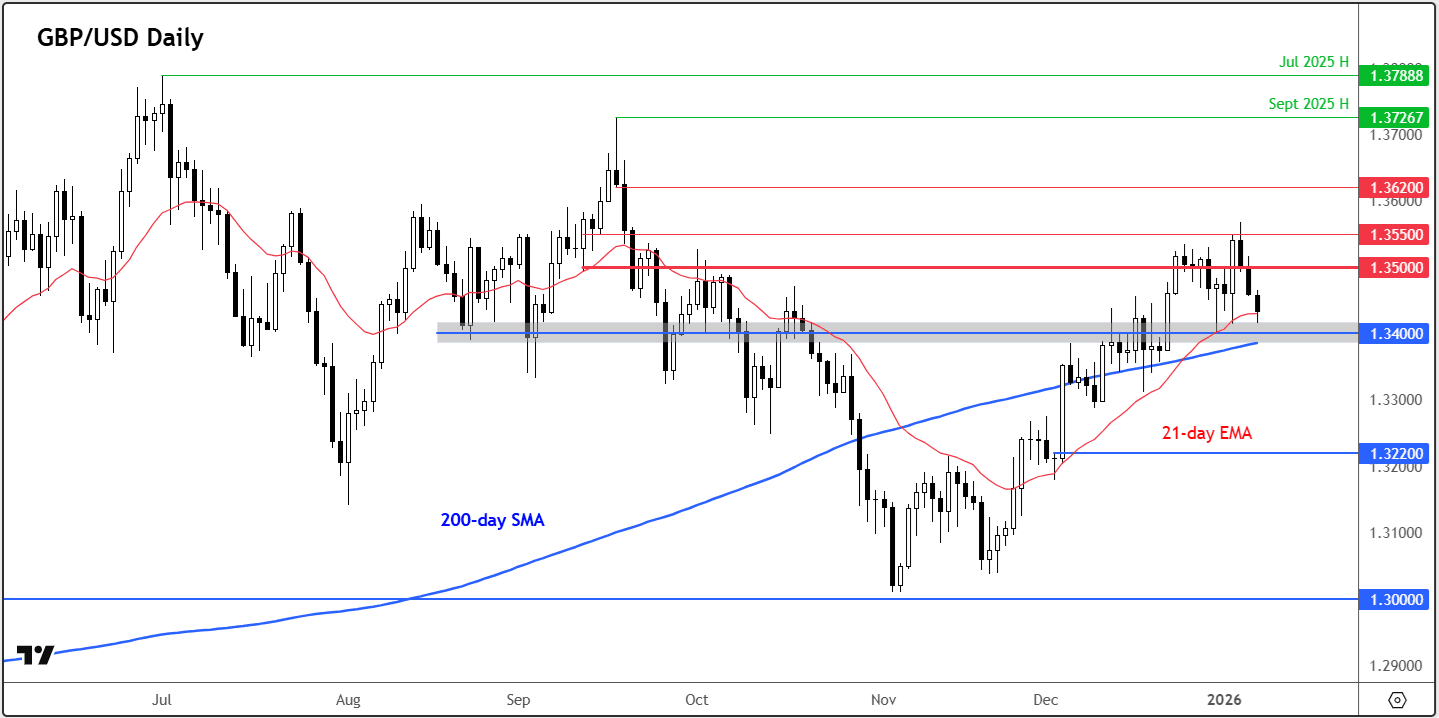
Traders who entered following Monday’s bullish engulfing candle are quickly finding themselves on the back foot.
A break below Monday’s low of 1.3415 could increase the risk of position unwinding, potentially triggering a downside squeeze and a deeper corrective move in cable.
On the downside, initial support is located near 1.34 - a technically significant level that also coincides with the 200-day moving average. A decisive break below this area would tilt the risk towards a more pronounced trend reversal.
On the upside, resistance is now clearly defined around 1.3500, with a secondary hurdle near 1.3550.
Overall, the GBP/USD forecast is becoming increasingly indecisive. Upcoming US labour market data could set the tone for the cable in as far as the near term is concerned.
The slightly longer-term view will be determined by the BoE’s actions later this quarter.