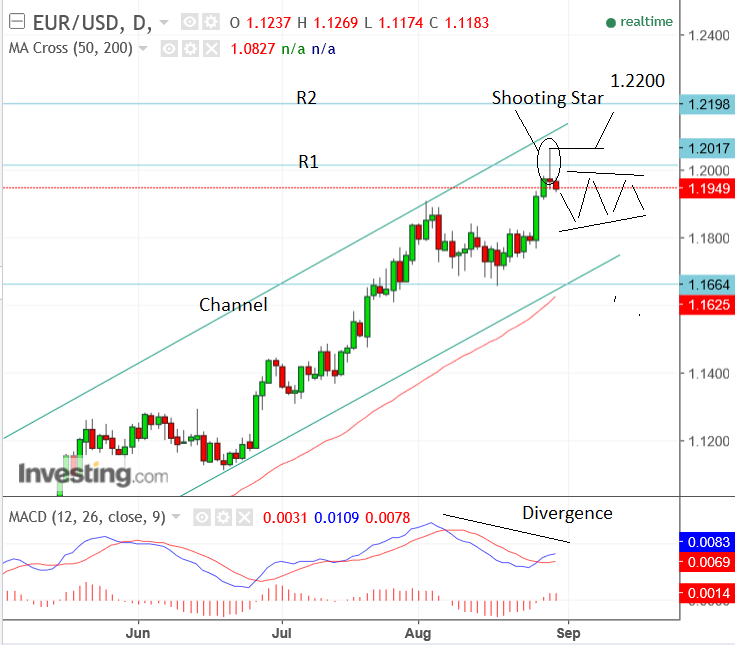
The Euro to US Dollar exchange rate has been in a strong uptrend since the start of the year and most recently it continued that trend up to a new high of 1.2069 on Monday, August 28.
The pair pulled sharply back from its intraday highs, however, and finished the day near its open and lows, describing in the process a bearish Japanese candlestick pattern called a shooting star.
Shooting stars often occur at turning points in the trend, however, on their own, they are not a sufficiently fail-safe sign to indicate a definite reversal of the trend.
If the subsequent day is also bearish, then that enhances the candlestick's predictive power, so if today ends lower than it opened then risks will be skewed to further downside in the short-term.
The trend up has been strong and it is rare to see such a strong trend suddenly reverse.
What we think is more likely to happen is that the exchange rate will probably consolidate instead, by which we mean a move in a sideways range for a while.
That this could happen between the 1.2000 and 1.1800 levels, we think is quite likely.
There are several other factors which also suggest a pause in the uptrend.
The first of these is the diverging MACD, momentum indicator in the lower pane, which failed to match the recent high made in the price; this divergence is a bearish sign.
The second is the R1 monthly pivot situated at 1.2017, which is a level traders often use to trade counter to the prevailing trend, as is often associated with pauses and reversals.
Nevertheless, despite all these signs, the uptrend remains technically intact and therefore more likely to continue than not.
We would, however, be looking for confirmation of a continuation higher from a break above the 1.2069 highs with a target thereafter at 1.2200.
Technical analyst Richard Perry at Hantec Markets sees the 1.1909 level as key, and a break below as the beginning of the end of the uptrend.
He too notes yesterday's 'shooting star' but defines it as a doji, which has less bearish connotations.
It may be that on his charting package the pattern was more like a neutral doji as different data providers can produce quite a wide variety of open, high, low and close prices.
Perry notes further:
"The bulls have held on to the breakout above $1.1909, however, the way that the market turned back from an intraday peak of $1.2069 suggests a little reticence. A doji candle (open and close at or very close to the same level) reflects uncertainty and coming with an intraday gain of over 90 pips, the reversal into the close poses some questions now.
"The market is flat this morning, however, the momentum indicators have lost some impetus in the breakout. The bulls will now need to hang on to the breakout support at $1.1909 otherwise the momentum in profit-taking could set in."
Analyst Robin Wilkins at Lloyds Bank highlights the tough resistance levels in the 1.20-23 zone which makes it hard to break above.
"From a medium-term perspective, 1.20-1.23 is very strong resistance and with a number of USD rates reaching similar levels we see a greater risk of a pullback towards 1.15. However, despite one-day reversal patterns in the candle charts we still see the risk of further tests of the topside, especially while over today’s 1.1930-1.1875 support region," says Wilkins.
Karen Jones, technical analyst at Commerzbank remains bullish on the Euro's prospects, saying only a drop below 1.1662-35 would negate the bullish move.
She also describes the shooting star as a doji:
"We note the doji on the chart and may see it consolidate very near term, the market stays immediately bid above the early August high at 1.1910. Below 1.1910 lies the 1.1848 August 11 high. But only if an unexpected drop below the 1.1662/35 mid-August low, the late July low, and the five-month support line would negate the bull move."