The Aussie Dollar will continue rising suggest studies carried out by technical analysts at Société Générale and Commerzbank who have drawn their conclusions from studying charts of the pair.
"AUD/USD has evolved within a large inverse Head and Shoulders which denotes signs of an upside reversal," says SocGen's Stephanie Aymes.
Inverse head and shoulders are strong bullish reversal patterns composed of three troughs at similar levels, which end up forming a bottom in the market.
The middle trough is lower than the other two and composes the 'head' of the head and shoulders.
The troughs either side are at a similar level and compose the 'shoulders' of the pattern.
The pattern is activated by a break above the neckline at the level of the two intervening peaks.
"It has now confirmed the pattern and sustaining above 0.7570, a larger up trend looks on cards first towards April 2015 highs of 0.8165 with next target at 0.8460," says Aymes.
If there is a bearish counter-move, however, the analyst notes support at the 0.7750 level.
SocGen is not the only bank which is bullish the Aussie, Commerzbank's Karen Jones is also, although less exuberantly.
"The cross has broken higher from a large triangle formation that targets eventually 0.8715 (one year + target)," says Jones, who identifies the significant pattern as a triangle rather than an inverse head and shoulders (we concur).
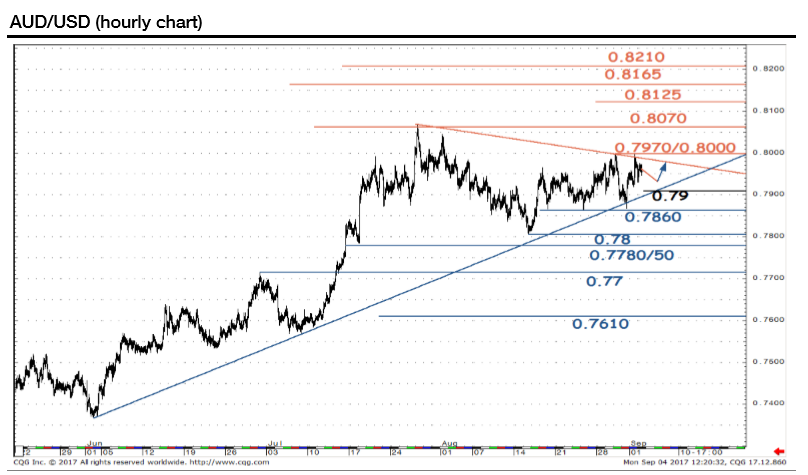
Short-term, however, she is less bullish, as the pair keeps hugging a trendline as if it is using it as a 'crutch'.
"AUD/USD continues to recover from the 3-month uptrend at 0.7888 (redrawn), intraday Elliott wave counts imply that the market will struggle to make further headway.
"Below the uptrend lies the 0.7808 current August low, which guards good support at 0.7748/41. It is where the February and
March highs are located and while above here the market will remain bid," said Jones.
Our own view share similarities with both the above in that it is bullish, with a target in the mid-80s.
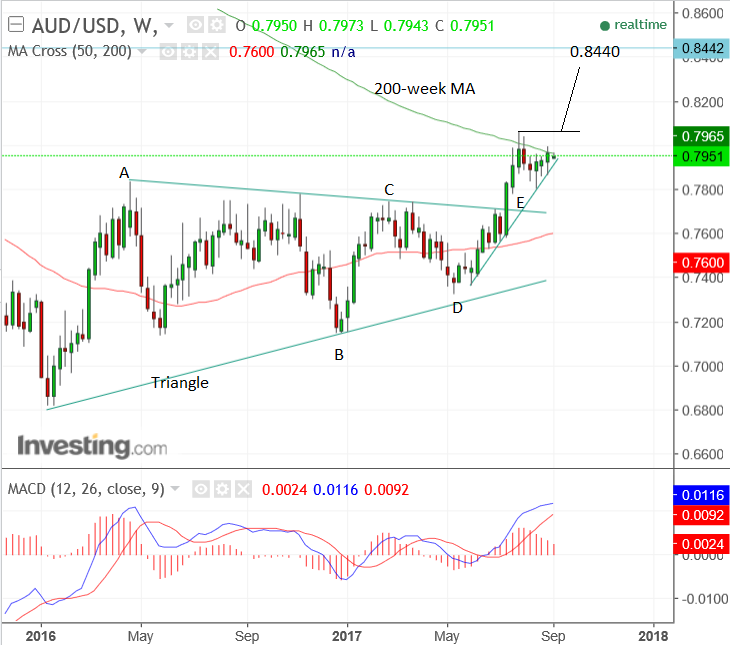
On our chart, we note the large triangle which recently finished forming on the weekly chart and then broke to the upside (see below).
The pattern qualifies as a triangle because it contains the minimum of five constituent waves - A, B, C, D, and E.
The breakout has not reached the target for the triangle at 0.8440, which we calculated using the standard method of taking the height of the triangle at its widest point, multiplying it by the golden ratio of 0.618, and extrapolating it higher from the point of the break.
The exchange rate recently stalled at the 200-week moving average (MA) at 0.7965 and has had difficulty moving above this level since.
It is often the case that prices have great difficulty in moving above the dynamic support or resistance offered by major moving averages, and we cannot be sure it will be successful, however, if the exchange rate manages to break above the previous highs at 0.8066 it will confirm a continuation higher to the eventual target at 0.8440, which the odds favour it eventually reaching.