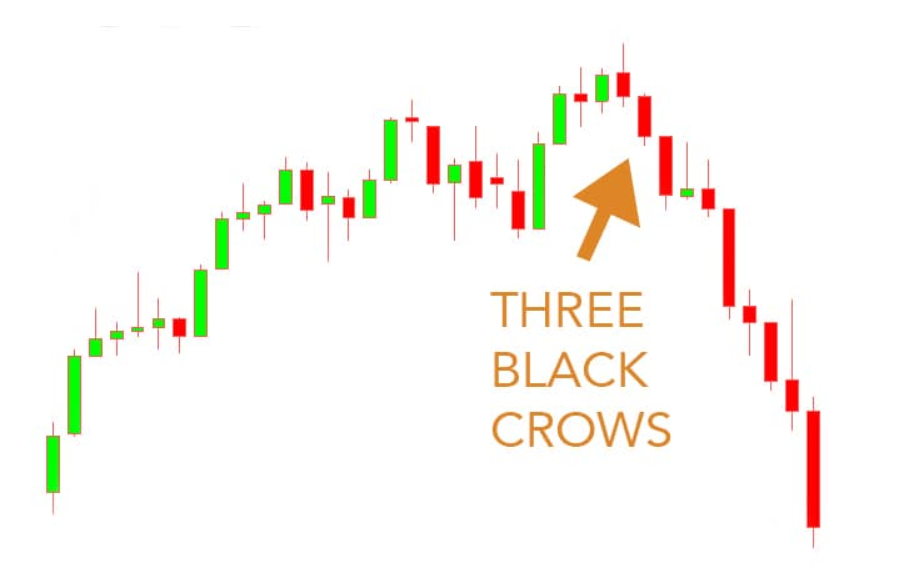
- The GBP/USD price chart has formed a bearish 3-black crows pattern
- It indicates a substantially lower exchnage rate may be on the horizon
- The GBP/USD example meets all the criteria for classification in the higher success-rate category
© SlayStorm, Adobe Stock
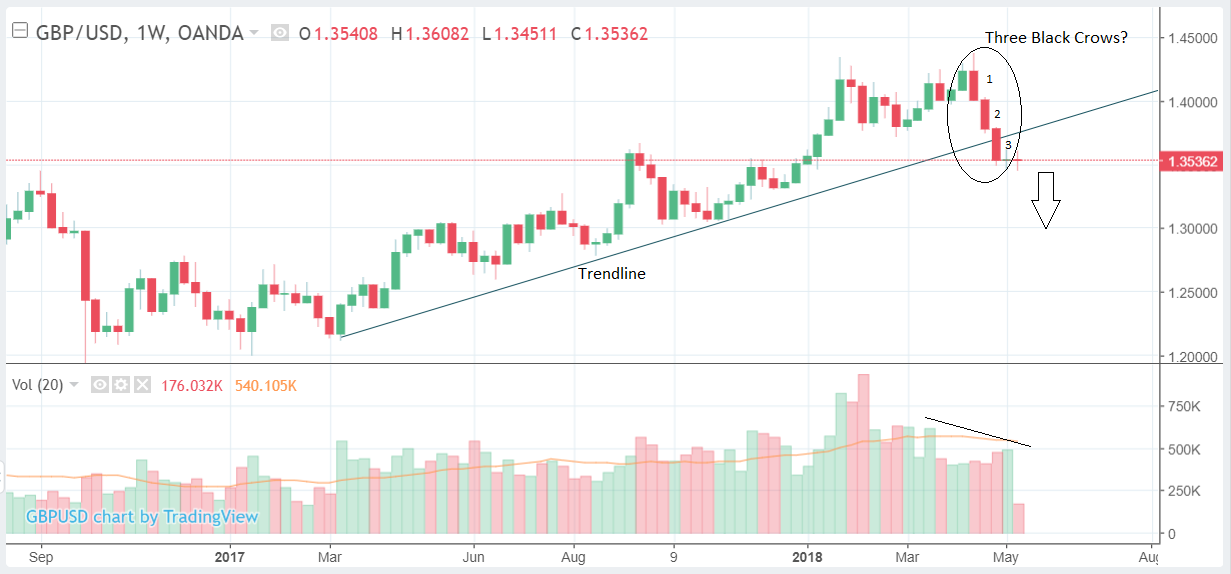
Beware sterling bulls, GBP/USD's weekly price chart has formed a bearish reversal pattern called '3 black crows', which bodes ill for the future of the exchange rate.
The pattern looks distinctly like a staircase lower and indicates a likelihood that the currency pair will decline even further than its current spot rate at 1.3500 - possibly even as low as 1.3000 eventually.
(Image courtesy of Hit & Run Candlesticks)
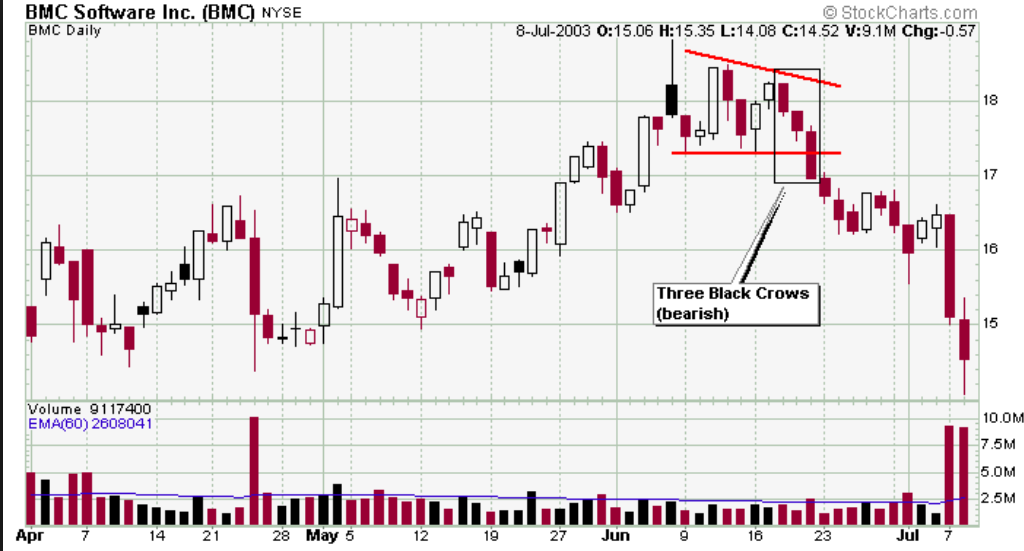
The pattern comes from the old art of Japanese candlestick charting which was developed by a rice trader called Homa; it is composed of three similarly lengthed, longer-than-average down candles in a row.
If 3-black crows occur at the end of an uptrend it strongly indicates the possibility of a bearish reversal and a much, much deeper decline.
Three black crows now appear to have occurred on the weekly chart of GBP/USD and this suggests the trend lower will extend.
How reliable is it as an indicator?
As every trader knows there is no sure thing in financial markets, however, there are certain characteristics which supposedly improve the odds of the 3 black crows successfully forecasting lower prices.
The first of these criteria is that the three down bars should increase slightly in length as they descend, implying an increase in bearish sentiment.
In the case of the 3 black crows on GBP/USD, this appears to be broadly the case as reflected in the lengths of the candles noted below.
Candle 1. 1.4236 - 1.4004 = 232 basis points (bps)
Candle 2. 1.4004 - 1.3782 = 222 bps
Candle 3. 1.3782 - 1.3531 = 251 bps
Although the candles do not show a gradual elongation, as candle two, not one is the shortest, the fact No 3 is the longest is the most significant fact, and suggests the pattern passes this criterion for success.
Another important factor, according to Ed Carter, a trading expert at Hit and Run Candlesticks is that "it is important that the candles have very small (or nonexistent) lower wicks."
By 'lower wick' he means the difference between the close and low of the week, which should not be big; and in the case of the pattern on GBP/USD, this too seems to be the case, for all three candles.
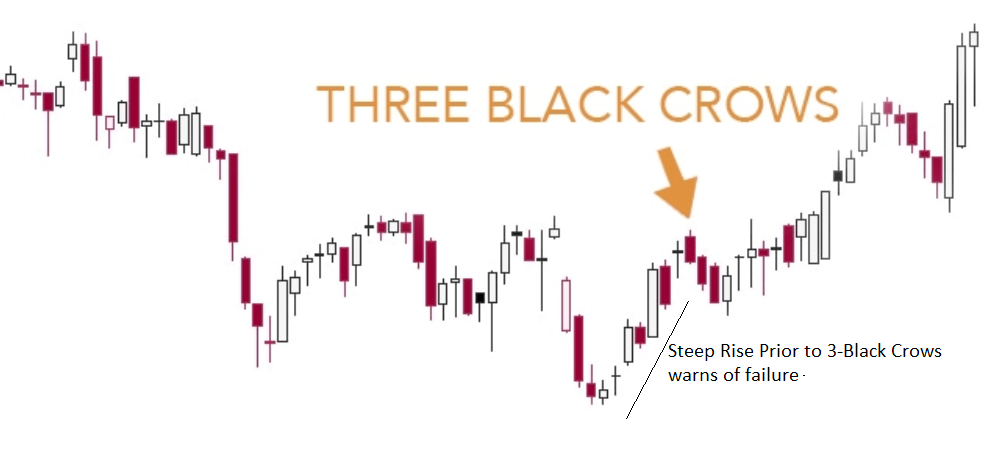
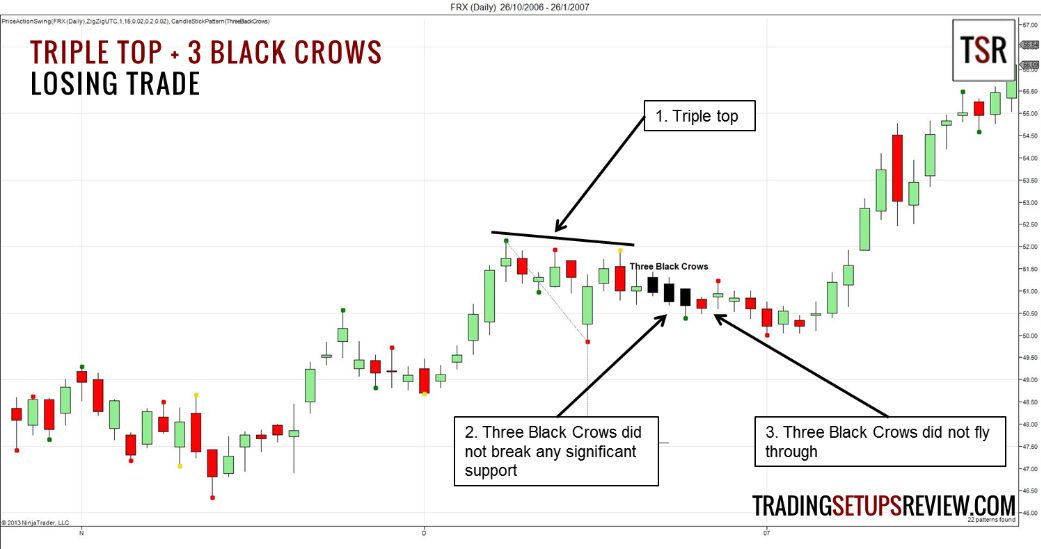
Finally, there is a third criterion which is based on the relative steepness of the angle of ascent prior to the formation of the pattern.
In cases where the pattern fails it is almost always the case that the trend prior to the pattern's formation was steeper than the downside trend of the 3 black crows.
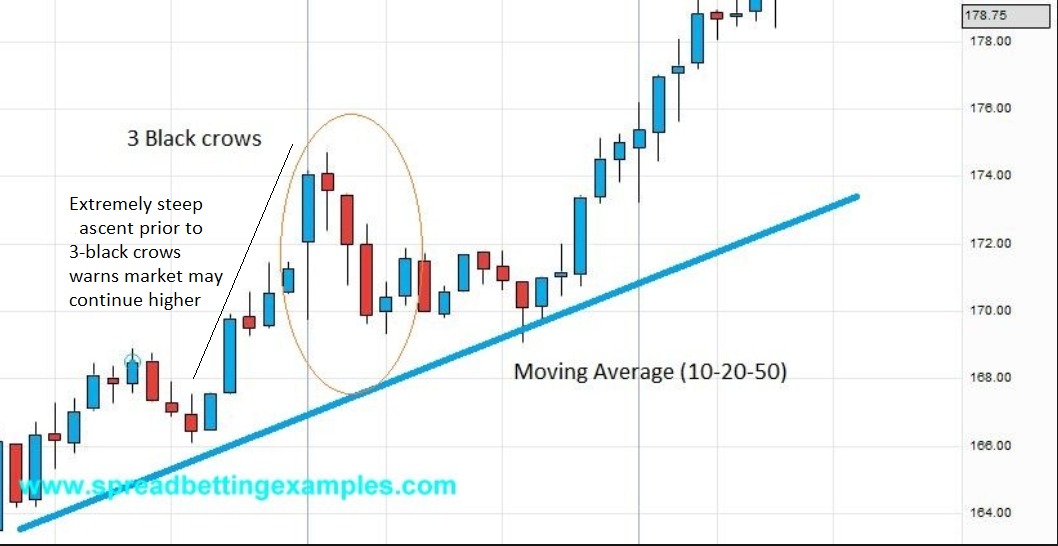
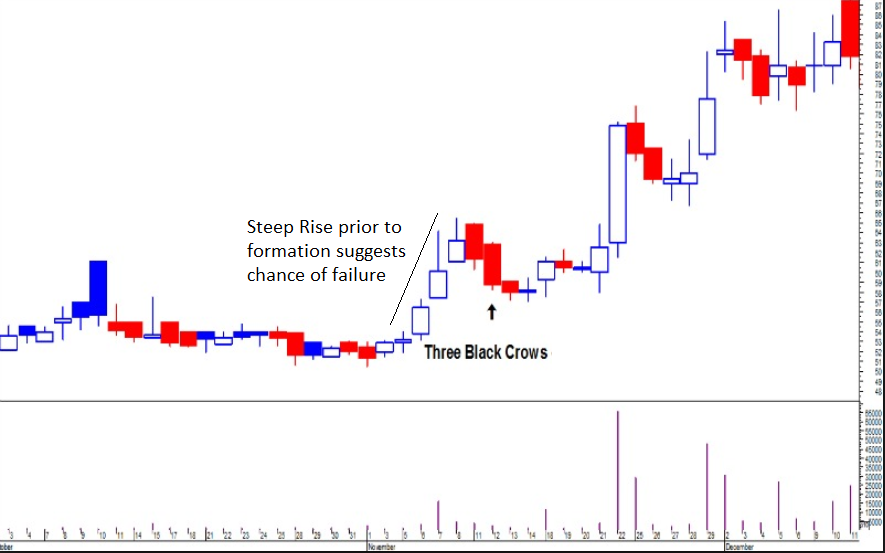
In the cases in which the pattern failed to herald a continuation lower shown below, the trend prior to the formation was without exception steeply bullish.
(Image courtesy of Hit & Run Candlesticks)
(Image courtesy of stock-trading-info-centre.com)
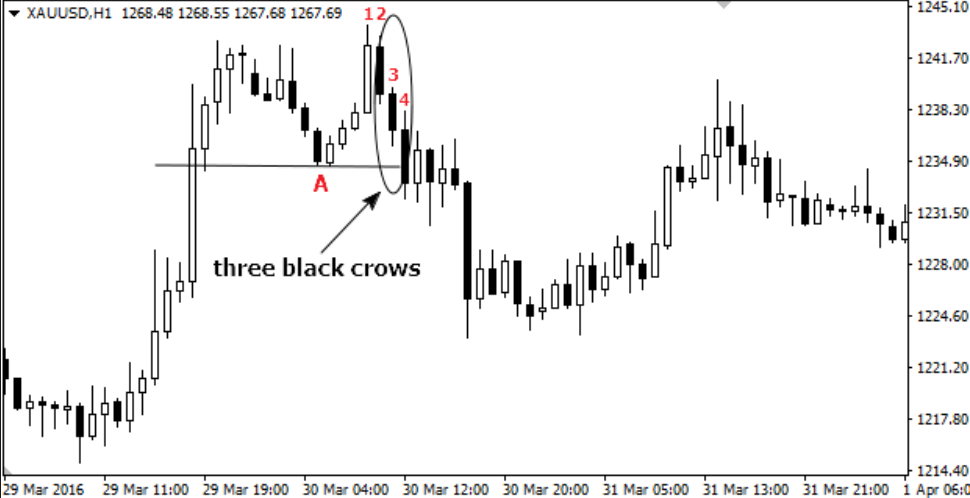
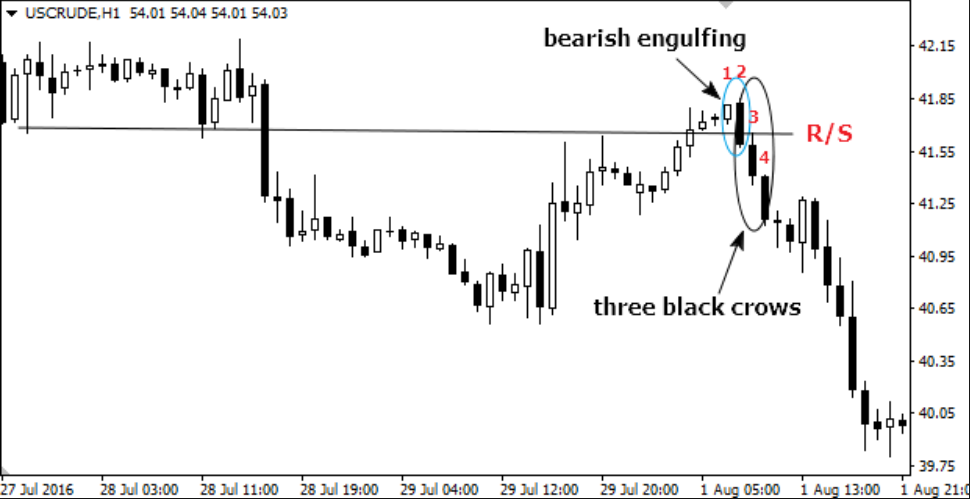
One quick way of deciding whether this criterion is met is to look at the 3 candles immediately prior to the three black crows and compare them with the crow candles. If the prior candles show a steeper rise than the descent of the three black crows, the pattern has a higher chance of failure.
Yet it is worth looking at the overall picture as well, since in the example below the three candles immediately before the 3-black crows formed were not steeply bullish, however, the overall uptrend prior to the bearish signal was quite strong and steep, in line with the general rule.
Successful patterns almost universally show a not so steep uptrend prior to the development of the 3 black crows which show steeper relative velocity lower.
(Image courtesy of Forex Strategies Library)
(Image courtesy of Forex Strategies Library)
(Image courtesy of traders-talk)
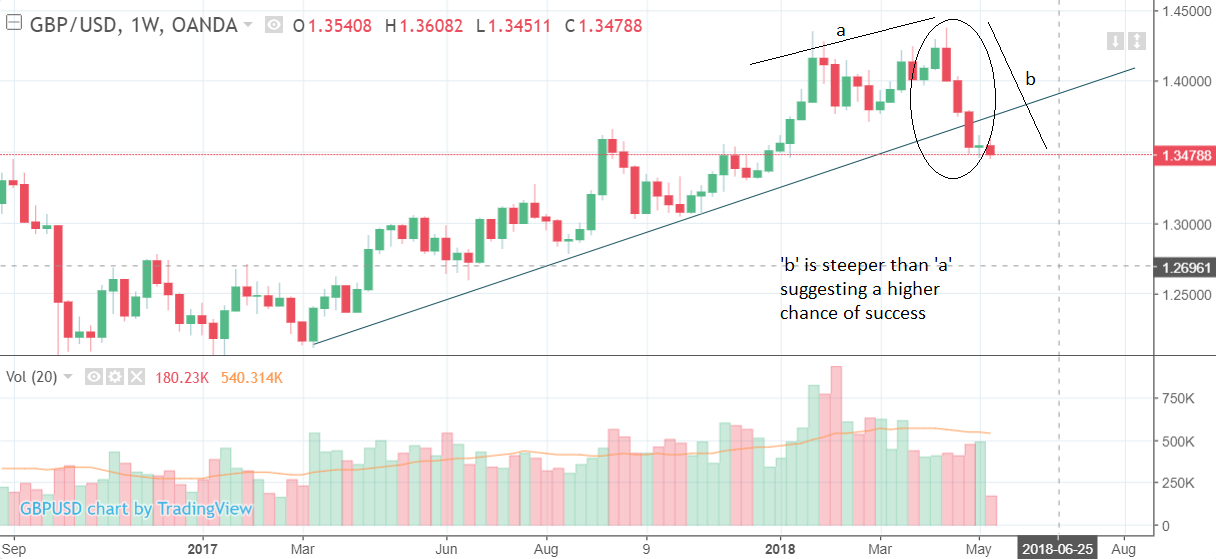
Judged against this criteria the pattern on GBP/USD shows a high chance of success (see chart below).
Note how the uptrend prior to the pattern ('a') is actually rather weak and shallow compared to the decline during the three weeks of the 3-black crows ('b') - suggesting that the pattern will successfully forecast substantially lower prices in the future.
Get up to 5% more foreign exchange by using a specialist provider to get closer to the real market rate and avoid the gaping spreads charged by your bank when providing currency. Learn more here.