- USD/INR reached record levels in August, GBP/INR didn't.
- GBP/INR is pair now giving off mixed signals on the charts.
- The downside, and the bears, are likely to prevail for GBP/INR.

© Ash T Productions, Adobe Stock
The Rupee may have been one of the worst hit emerging market currencies during the Turkish Lira crisis but when stood next to the Pound, there are mixed signals on the charts, making directional calls rather difficult.
USD/INR has risen to historic highs above the magic 70 level and while the Pound-to-Rupee rate has also joined in on the rally, it hasn't reached a record high like the US Dollar did.

Above: USD/INR rate shown at daily intervals.
Monday brought a surge in Pound-to-Rupee rate in response to speculation that Brussels is prepared to make concessions to Prime Minister Theresa May in order to move the Brexit talks along.
This, along with the Lira contagion hitting the Rupee, propelled the GBP/INR into a long green up-bar from its previous 87.83 lows to 89.42 highs, which was a rise of almost 2 Rupees in only 48 hrs.
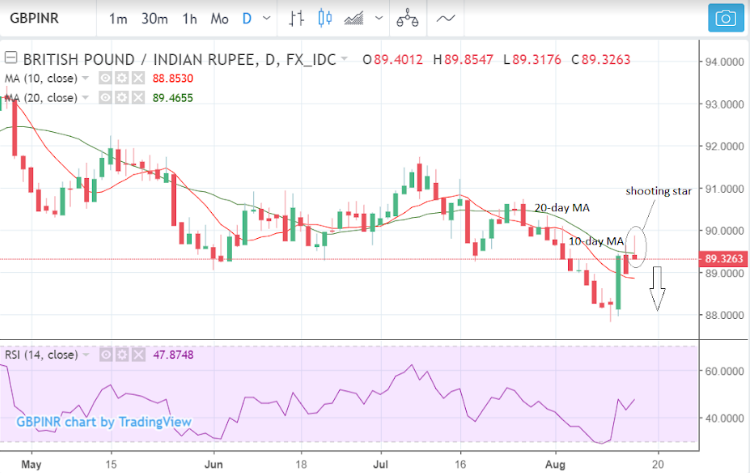
Above: Pound-to-Rupee rate shown at daily intervals.
Whilst this looked like the end of the bear trend and the start of a new uptrend, the pair subsequently failed to follow-through to the upside and instead, has moved sideways in subsequent days. The spot rate was 89.32 Thursday, marginally lower than Monday's highs.
Whilst the USD/INR appears to be in an unstoppable uptrend the same cannot be said of the Pound-to-Rupee rate, which is giving off mixed signals that indicate it could soon move in either direction.
The daily chart shows GBP/INR has pulled back into the 'sell zone' between the 10 and 20-day moving averages (MA), the optimum area for bearish traders to reload their short positions in anticipation of a resumption of the downtrend.
Moreover, the pair has formed a bearish shooting star candlestick pattern within the sell zone, increasing the probability that a bear move will follow.
This suggests that, far from a reversal of the downtrend, the Pound-to-Rupee recovery has merely been a correction that provided sellers with better prices to enter the market and offload at.
Yet the long green up-bar on Monday remains a monument to those optimistic about the Pound. It is almost always the case that strong up-days such as these start new longer-term trends higher, so it continues to give the price action a bullish appearance on the chart that has not been entirely dispelled by the sell zone set-up.
Overall, we think the market could break in either direction now, although given the longer-term trend is down, its probably safer to remain short than it is to get behind a new thrust higher out of the sell zone.
The Rupee has been hit by the Turkish debt and currency crisis. It is feared that India's current account deficit, which is equal to 2.0% of GDP, makes it as dependent on foreign debt just as much as Turkey's higher 5.0% deficit does.
India's current account deficit has risen in 2018 because of a sharp increase in oil prices, among other things, which has seen Indians sell more Rupees on the market in order to buy the Dollars required to purchase oil at higher prices.
The oil price rise and subsequent weakness in the Rupee are now making the Reserve Bank of India's job of keeping inflation in check all the more difficult. Oil makes up for a third of all Indian imports. It is possible the recovery in the Pound-to-Rupee rate on Wednesday was due to fall in the oil price to an 8-week low.
Advertisement
Get up to 5% more foreign exchange by using a specialist provider to get closer to the real market rate and avoid the gaping spreads charged by your bank when providing currency. Learn more here