The euro saw an incredibly volatile end to the week after the merry gentlemen of Frankfurt got their printing presses out. Now where to, for EUR/GBP?
- The head and shoulders top pattern which had been forming at the highs is still visible, and viable, suggesting EUR/GBP downside
- If the currently stable sentiment extends there is a possibility the euro could be vulnerable to carry, which could push it lower.
The euro to pound sterling exchange rate (EUR/GBP) has ended the week higher than where it started despite the European Central Bank (ECB) announcing a massive increase in stimulus on Thursday.
The euro has actually given up the majority of the gains captured in the wake of the ECB's Thursday press conference as markets realise they may have overreacted to suggestions ECB interest rates were unlikely to fall further.
Once traders were able to digest what had actually been announced on Thursday they realised the ECB has actually announced a convincing set of policy initiatives which should ultimately see a lower euro as a byproduct.
That said, for now the euro appears well protected to the downside against the British pound by the 50 day moving average. This technical support zone now at 0.7716 matters for the pound; the currency appears unable to cross beyond this important technical threshold in both the GBP/USD and EUR/GBP levels.
Traders are using the 50 day moving average as a trigger to sell any pound strength.
Latest Pound/Euro Exchange Rates
  | Live: 1.1598▼ -0.03%12 Month Best:1.1754 |
*Your Bank's Retail Rate
| 1.1204 - 1.125 |
**Independent Specialist | 1.1436 - 1.1482 Find out why this is a better rate |
* Bank rates according to latest IMTI data.
** RationalFX dealing desk quotation.
Therefore, before we call a bottom in sterling's downtrends we would want to see a break of the 50 day moving average which signals a shift in trend in favour of the UK currency.
You may say that the rejection at the 50 day moving average was coincidental and it was Mario Draghi who should take the credit for pushing the euro higher. But, in the hour or so until the Draghi sell-off we witnessed a fierce battle for control over the level, which was located at 0.7654.
The admission from the ECB that it was unlikely to cut rates any further came as a surprise to markets effectively putting a cap on future easing, and this fuelled the impressive recovery in the euro exchange rate complex that followed.
The ECB announced a variety of measure to try to stave off deflation and stimulate the economy, including:
• A reduction of the base lending rate, or ‘repo’ rate to 0.00%
• A cut of -0.1% off the deposit rate, bringing it down to -0.4%
• An increase of 20bn in monthly asset purchases to 80bn.
• A widening of eligible assets for purchase to include corporate bonds.
• The introduction of another LTRO – or long-term refinancing scheme, ie lending money to banks for as little as -0.40% interest!
In short, the ECB will incentivise lending by paying banks to borrow from it!
The market’s initial reaction to the news was to sell-off, falling down to within a few points of the PSL target at where the 50-day Moving Average had been several days ago at 0.7643 (the 50-day had risen marginally to 0.7654 since our forecast).
The news that this was likely to be the last time the ECB cut rates, however, led to rip higher up to 0.7809.
Market analysts generally viewed the palanquin of measures as sufficient, with Ian Kernohan, economist at Royal London Asset Management, saying expectations has been exceeded:
“Today’s announcement more than met expectations for policy easing, with a cut in the refi and deposit rates, a €20bn increase in monthly QE purchases, purchases of corporates bonds, and a new Long Term Refinancing Operation (LTRO) arrangement.
"The addition of non-bank corporate bond purchases and the new LTROs, where borrowing can be as low as the deposit rate, were perhaps the main surprises.
“The initial reaction of markets was very clear, the Euro fell sharply and equities rallied. Draghi’s comment at the press conference that he thought further rate cuts were now unlikely, reversed this initial reaction. Looking through these very short term reactions however, the proof of the pudding will be a rise in Eurozone inflation expectations and a further pick up in lending growth.”
EUR/GBP is currently hitting resistance from the 20-day moving average at 0.7783, although this is not as formidable a resistance stratum as the 50 or 200-day so it may give way.
The head and shoulders top pattern which had been forming at the highs is still visible, and viable, and there remains a risk of a break back down if markets suddenly see fresh bearish implications for the euro, for example, from use as a carry funding currency if market risk remains stable.
Threat of Carry Selling Could Keep Euro Gains Capped
As a carry funding currency, the euro would be vulnerable to being sold by speculators seeking higher yielding returns either from buying higher yielding emerging market FX, or by purchasing Australian or New Zealand Dollars, which have interest rates of 2.0 and 2.25% each.
The carry traders park their money in the high yielding currency’s banks so they can earn more interest than they would in the euro-zone, or indeed than it costs them to borrow.
Carry trading is especially popular during times of risk appetite, and if the currently stable sentiment extends there is a possibility the euro could be vulnerable to carry, which could push it lower.
Technical Outlook for EUR/GBP From Here
From a technical point of view the pair is sporting a head and shoulders (H&S) reversal pattern at the highs.
This consists of a peak (the ‘left shoulder’) followed by another slightly higher peak (the ‘head’) followed by another slightly lower peak (the right shoulder).
It has bearish connotations which are realised if the neckline situated at the level of the two intervening troughs in the pattern is breached.
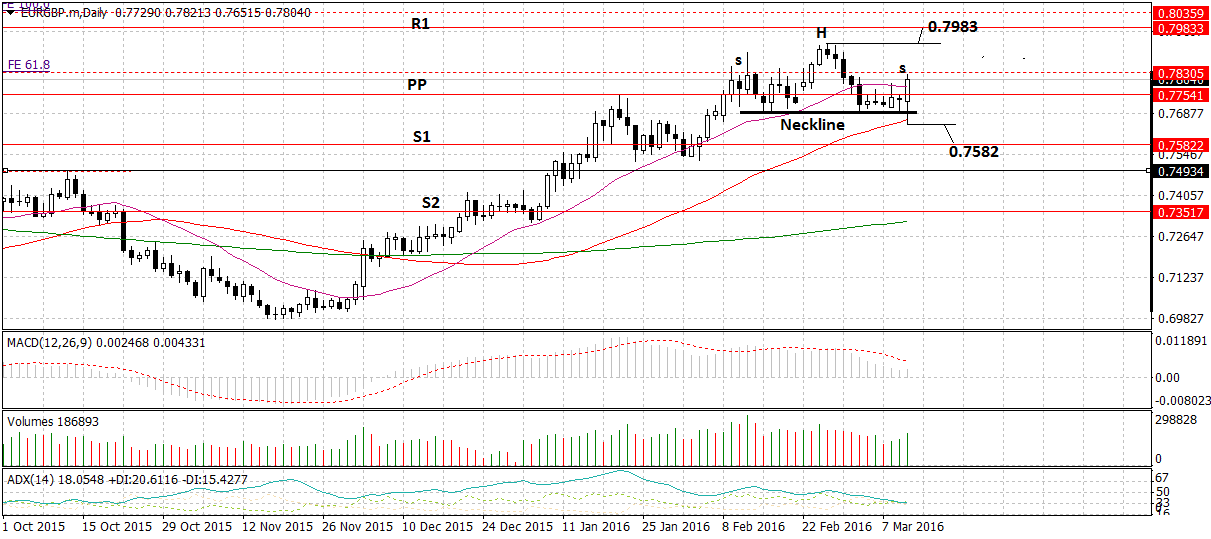
In this case the neckline is at 0.7687, but thes temporary break lower to 0.7651 means a break below that low would be required to confirm further downside.
The lower volume on the right shoulder increases the pattern's validity.
The H&S minimum target at just below the S1 monthly pivot at 0.7582, which is the target for the pair.
Given the backlash higher, however, a move above the H&S highs at 0.7928 would signal a continuation of the bullish up-trend to the next target at R1 at 0.7983, and cancel out the H&S pattern.