- GBP/AUD in short-term downtrend with no signs yet of reversal
- Major support underpins current price levels
- Indicates caution is warranted before "going short"
- CPI and Retail Sales are the key releases on the economic docket

Image © Adobe Images
- GBP/AUD reference rates at publication:
Spot: 1.8395 - High street bank rates (indicative band): 1.7750-1.7880
- Payment specialist rates (indicative band): 1.8230-1.8303
- Find out about specialist rates, here
- Or, set up an exchange rate alert, here
The Pound to Australian Dollar exchange rate is trading at around 1.8473 at the time of writing after falling 0.59% in the week before. Studies of the charts suggest the pair will continue falling in line with the dominant downtrend.
The 4 hour chart - used to determine the short-term outlook, which includes the coming week or next 5 days - shows the pair steadily descending in a series of declining peaks and troughs. The trend is down and although the pair has just stalled at a major trendline and the 200-day MA, is likely to continue in the absence of any reversal signs.
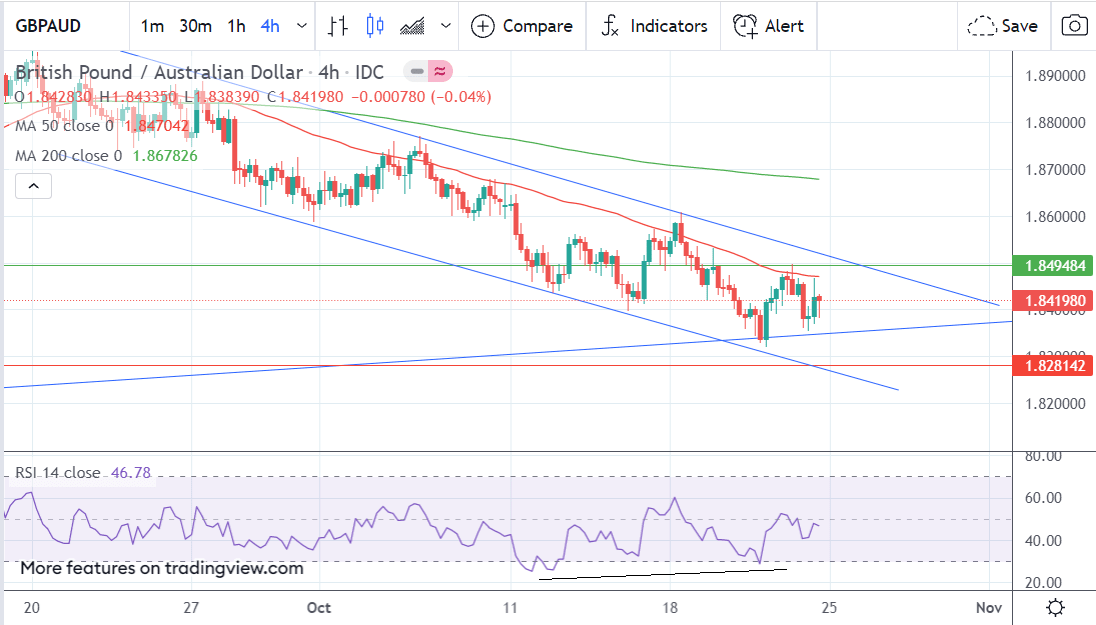
A short-term downside target is difficult to determine with any accuracy, however, because there's so much support lying just below price.
Three major long-term averages - the 200-day, 200-week and 50-week MAs - all lie just below price in the 1.82s and 1.83s and will provide a magnet for bullish day-traders looking to scalp the bounces.
Furthermore, another key support level, the 0.5 Fibonacci ratio - or midpoint - of the previous move lies at 1.8276.
Even if price breaks through the MAs it will also then encounter long-term support at 1.8200 - and it is not until a break below that bears will get the all clear.
The RSI momentum indicator has been converging with price action when you compare the Oct 12 low and the Oct 20 low.
This happens when the price makes a new low but the RSI does not follow suit. It indicates waning bearish momentum and the possibility the market will stop falling.
It is a warning not to get overly bearish, and whilst on its own, it is not enough to suggest the downtrend will end immediately taken together with the brace of support below price it suggests caution before going short.
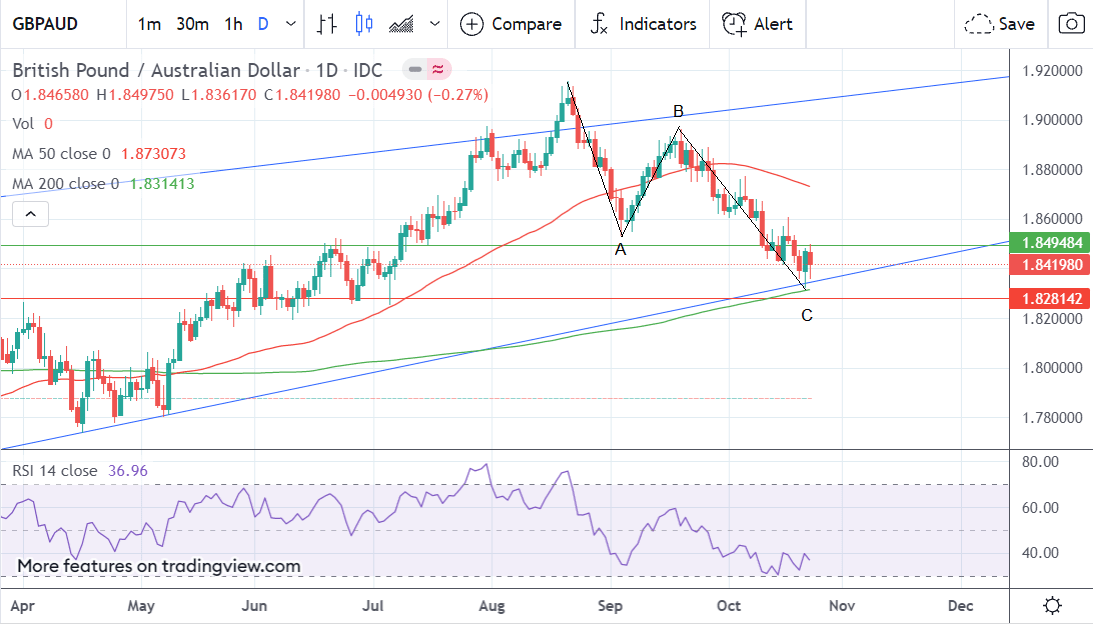
The daily chart shows the pair is in a sideways trend without a strong bias either way.
The pair has formed what may be a measured move since the August highs.
This pattern is a symmetrical 3-wave zig-zag, where the final 3rd wave down (C) is usually of a similar length as the first wave (A), or fibonacci extension thereof.
The pattern on GBP/AUD has probably finished since both A and C are currently 6 cents long.
If the pattern has finished, it could indicate the pair will experience a bounce next week, however, it is impossible to say whether the bounce will be part of a major reversal or just a short-lived reaction before the market continues falling.
The daily RSI, for example, continues to show bearish momentum.
The daily chart shows how the trend could play out over the medium-term, or next week to month.
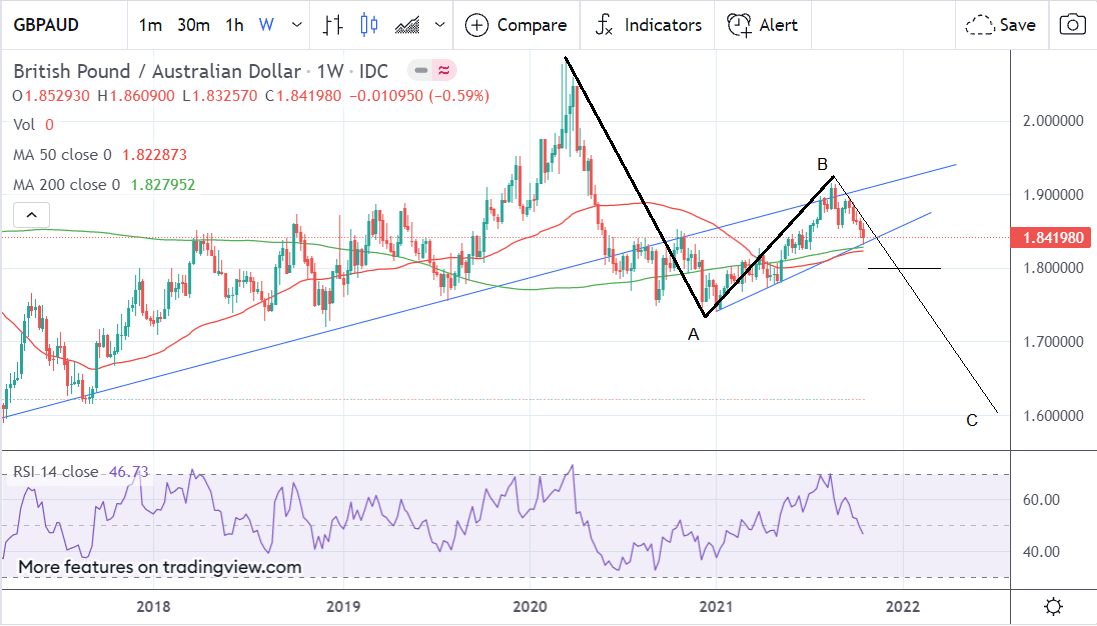
The weekly chart - used to give an idea of the longer-term outlook, which includes the next few months - is showing a more bearish picture for the pair.
The steep descent from the March 2020 highs is a bearish sign. Further, the lack of strength in the up move that launched itself in January 2021, suggests bears appear to be in control longer-term.
We also note what could be a similar measured move pattern forming - as has on the daily - beginning with wave A going down from the Mar 2020 highs, wave B encompassing the move up from the Jan lows and possibly C starting with the move down from the August highs at 1.9154.
If this is the case, it could indicate a much more bearish long-term outlook for the pair, with the potential for a bear trend to take the exchange rate down to circa 1.6000 eventually.
The Australian Dollar: What to Watch
The first key data release for the Aussie Dollar in the week ahead, is inflation data.
This begins with the Reserve Bank of Australia’s Trimmed Mean CPI for the third quarter, which is out at 00.30 GMT on Wednesday Oct 27, and is forecast to continue to show a 0.5% rise.
This is considered a much more accurate picture of the real level of inflation compared to official data since it provides a better picture of the longer-term trend.
At the same time as the RBA figures come out, official inflation data from the Australian Bureau of Statistics, will also be released. These are expected to show CPI continuing to rise by 3.8% yoy in Q3, but a slower 0.7% quarterly rise compared to 0.8% in Q2.
In Q2 inflation jumped as petrol prices rose and government subsidies unwound, however, the risk in Q3 is that prices will have retreated due to the reintroduction of lockdown measures to fight the Coronavirus Delta variant.
{wbamp-hide start} {wbamp-hide end}{wbamp-show start}{wbamp-show end}
Unless there is a surprise jump in inflation in Q3 the data is unlikely to affect the Aussie since underlying inflationary pressures from wages, for example, have been a lot more muted in Australia compared to the U.S. for example.
The RBA has stated on several occasions it does not see itself increasing interest rates until 2024 - much later than most other major central banks. Indeed, only last week the RBA intervened to push down rising borrowing costs by purchasing A$1bn of government bonds in an attempt to keep yields capped within its 0.10% target level.
The other key release for the Aussie in the week ahead is September Retail Sales, which is forecast to show a 0.2% rise in September compared to the -1.7% fall in August.
The slump in August’s figures was put down to large parts of the population being trapped in lockdown. September is expected to show a recovery.
A measure of cashless retail sale spend for the month, released by economics group NAB, showed an uptick in sales due to rising vaccinations and increased online shopping.
“Our data mapping points to a rebound in retail sales in September. We see the official ABS measure gaining 2.2% on a month-on-month basis.” Said NAB in its report.