
Image © DragonImages, Adobe Stock
- USD/JPY plummets after Trump says Fed policy on interest rates bad for the economy
- Suggests possibility of a weak-Dollar policy
- Charts, however, show uptrend remains intact for now
The Dollar fell versus Yen on Friday after U.S. President Donald Trump reinforced his criticism of the Federal Reserve's (Fed's) policy on raising interest rates.
The Fed's policy has led to a strengthening of the Dollar which, Trump says, takes away from the United States' "big competitive edge" and could hurt the U.S. economy.
The comments suggest the administration may begin to pursue a weak-Dollar policy, although quite how it will do so in practice remains unclear, for, after all, the Fed is supposed to be independent of the White House so it can keep raising rates regardless of the opinion of Trump, if that's what it believes is the right thing to do.
Yet regardless of 'ways and means' Trump's criticism has raised the spectre of currency war beginning and although ostensibly not in a position to 'pull the levers' he remains the president of the US and therefore an influential figure.
"China, the European Union and others have been manipulating their currencies and interest rates lower, while the U.S. is raising rates while the Dollar gets stronger and stronger with each passing day - taking away our big competitive edge. As usual, not a level playing field," said Trump in tweet.
Though not stated clearly, it is possible to extrapolate a scenario in which Trump might wish to fight back and 'make level the playing field' by creating the circumstances for the Dollar to go down.
In regard to USD/JPY, specifically, Trump's comments have led to a long red down-day emerging on charts.
The pair has now fallen from Thursday's peak of 113.18 to a current level of 111.81 - a substantial drop over a 24hr period.
The question now on everybody's lips is, is this the end of the Dollar's bull run against the Yen? And if not how much higher can it go?
The drop won't come as a surprise to many fundamentalists, who have generally been expecting something like this to happen and have been fairly biased to the downside for the pair, with several reported as seeing the pair peaking earlier this week.
Jordan Rochester, FX Strategist at Nomura, for example, said he foresaw the pair peaking in the mid 1.1350s - 114s, which has so far turned out to be a surprisingly accurate forecast, even if it was for the wrong reasons.
Rochester saw renewed strength in the Yen as being the main driver of a drop due to increasing trade war concerns causing safe-haven flows, and although this may in part be the case, the main driver of the current down-move is probably US Dollar weakness; not Yen strength.
Another big bank strategist who has been curiously bearish the pair is Marvin Barth of Barclays. Barth expected the pair to fall due to Yen strength in an interview with Bloomberg news earlier this week.
Barth was bearish due to his view that the market hadn't properly priced in Yen fundamentals. These include the fact the currency is 33% undervalued on a PPP basis, a stronger economy by per capita GDP, and finally due its risk hedging benefits on a "correlation" if not a "yield" basis, especially in the current uncertain geopolitical milieu.
Technicians remain more bullish on the whole since they follow the dictum that "the trend is your friend until the bend at the end" and with only 24hrs of weakness after many weeks of an uptrend its too soon to decide the uptrend has finished and new bear trend has started.
Analysts at website Actionforex.com for example see the pair topping, but only temporarily, before the uptrend renews.
"The break of 112.21 minor support suggests short term topping at 113.17, on bearish divergence condition in 4 hour MACD," says a note from Actionforex.
"Intraday bias is turned to the downside for deeper pull back. But downside should be contained by 111.39 resistance turned support and bring rebound," the say.
"Further rally is still expected. Break of 113.17 will resume the rise from 104.62 to 114.73 resistance next," they conclude on a bullish note.
A note from Reuters mentions how the pair "relapsed on Thursday, but found support at 112.05," they then go on to say the "Tenkan and kijun lines are positively aligned, reinforcing the upside bias," however given the current rate has fallen even further it's questionable how useful this analysis still is.
Longer-term, actionforex.com note how the exchange rate has broken above a descending channel, which gives the charts a bullish feel. The argue the correction back down to 104.62 is at an end and the trend is now on the up.
"In the bigger picture, current development, with the solid break of medium term channel resistance from 118.65 (2016 high), affirm our view that corrective fall from there has completed with three waves down to 104.62," say Actionforex.
Further, a "decisive break of 114.73 resistance will likely resume whole rally from 98.97 (2016 low) to 100% projection of 98.97 to 118.65 from 104.62 at 124.30, which is reasonably close to 125.85 (2015 high)," says the website.
Another way of generating a longer-term forecast view is by using a type of analysis called Elliot waves, which is a form of cycle analysis.
In the case of USD/JPY such an analysis yields an eventual upside target of circa 123.00, according to Alex Geuta, an Elliot wave analyst at Liteforex.
"If the presumption is correct, after the correction finishes, USD/JPY rate will continue rising to the levels of 113.95 – 115.50. The level 111.39 is critical in this scenario," says Geuta.
The bottom line is that the uptrend remains intact and likely to extend higher as long as 111.39 holds.
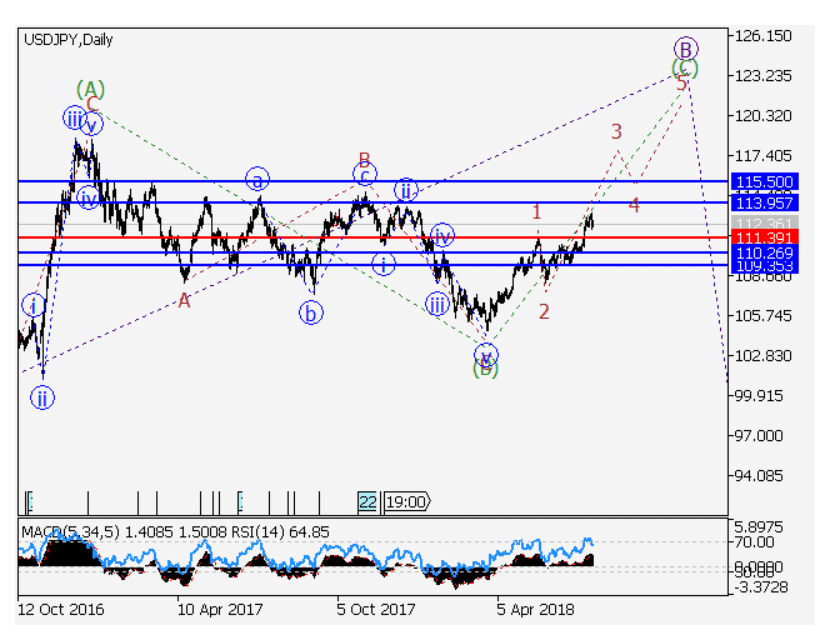
Elliot waves are cycles of buying and selling, of rising and falling prices, which are composed of 5 waves numbered 1-5, or labeled using Roman numerals, as in I, II, III, IV, and V.
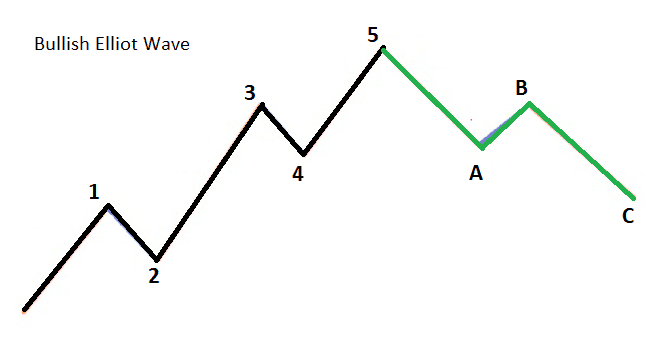
Waves 1,3 and 5 move in the direction of the dominant trend whilst 2 and 4 represent corrections. Wave 3 is almost always the longest and the strongest wave.
After a 5-wave pattern has finished the market corrects back in a shallower counter-trend move labeled A,B, and C.
Elliot waves are each composed of smaller 5-Elliot waves and are themselves components of larger 5-wave patterns, with waves within waves, ad infinitum.
Elliot wave analysts try to establish the point at which the current market is in the greater wave pattern, which enables them to predict what will happen next.
In the case of USD/JPY the pair is in a small wave 3 of a larger wave (C) as shown on the chart above. This is the basis for the expectation that it will rise.
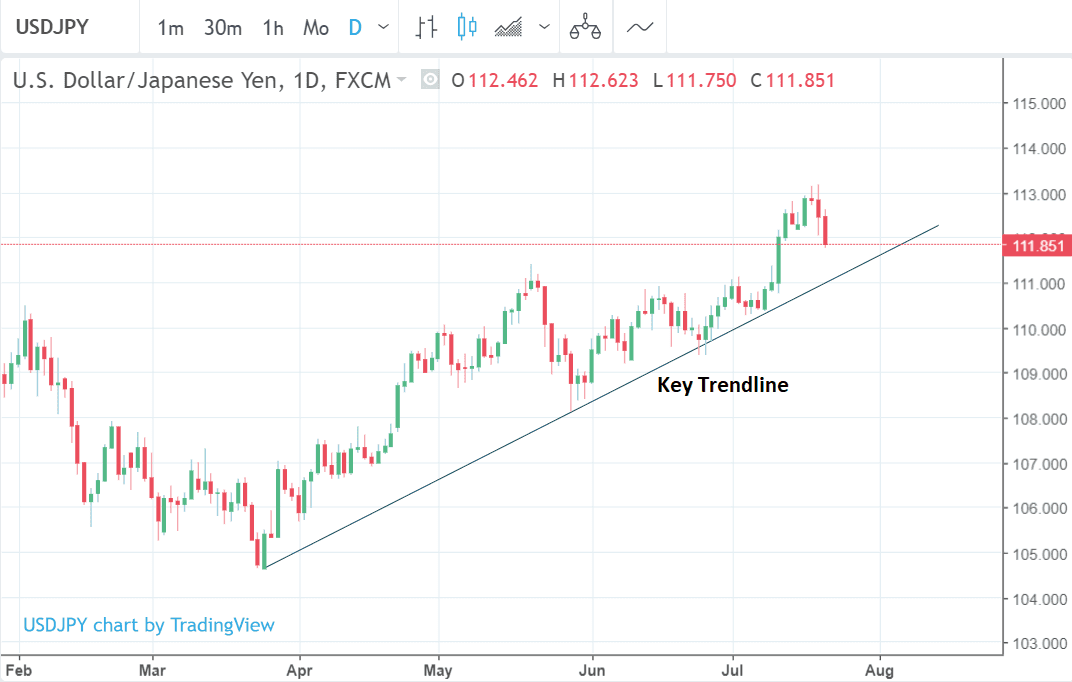
Our own analysis suggests the uptrend is probably still intact as long the trendline drawn from the March lows at around 111.00 remains unbroken, however, a close below on the daily chart would probably indicate the uptrend was reversing and either a sideways or bear trend was taking over.
Advertisement
Get up to 5% more foreign exchange by using a specialist provider to get closer to the real market rate and avoid the gaping spreads charged by your bank when providing currency. Learn more here