- GBP/USD is currently trading at 1.3430s but is forecast to weaken to the 1.32s eventually
- Implied valuations suggest the pair is overpriced and due a fall
- A chart pattern called a double top forecasts an extension even lower
© SlayStorm, Adobe Stock
The Pound-to-Dollar rate made a new low for the year yesterday after it fell to a trough of 1.3391, and although this is a far cry from the 1.4376 April highs it is still considered overvalued by some - and therefore vulnerable to even more downside.
GBP/USD has lower to go according to 'implied valuations' which are "decidedly bearish" in the short-term, according to Emmanuel Ng, an analyst at OCBC Bank in Singapore.
The implied valuation is calculated by dividing the price of an asset - usually a sovereign bond - by its price in a different currency.
The result is an ideal value for the exchange rate which is compared with the real exchange rate. If the real exchange rate is higher than the implied valuation - as is the case with GBP/USD - the expectation is that it will fall in the future when the market wises up to the mispricing.
It is a similar concept to purchasing power parity (PPP) which comes up with an estimate or fair value for a currency pair by dividing the price of a basket of goods by the same basket in another currency.
Technical analysis of the GBP/USD price action and price chart is also suggesting the exchange rate probably has lower to go.
The pair has formed a double-top price pattern at the April highs. Double tops look like the letter 'M' and suggest a reversal in the trend and more downside - in this case, all the way down to the 1.32s (see chart below).
"It’s worth bearing in mind that double-tops often provide a target of sorts," says Bill McNamara, a technical analyst at the Technical Trader.
The target is calculated by taking "the distance from the top of the pattern to the intermediate low – and that amount extrapolated to the downside," he says.
The measuring distance is represented on the chart below using a green line labeled 'x'. The theory is that this line extrapolated lower from the break gives a downside target for the bear trend.
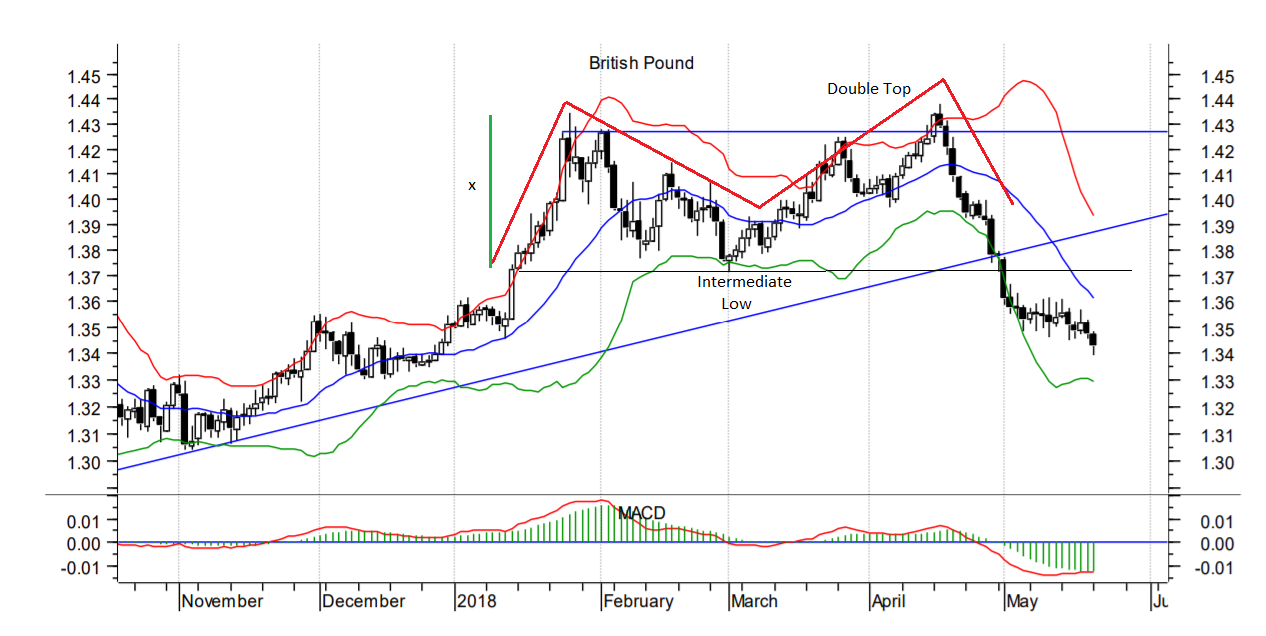
(Image courtesy of the Technical Trader)
"In this case, the difference is 5 cents and, if that amount is deducted from the intermediate, you get a target of 1.3270 or so," says the analyst, providing a useful estimate of the next target lower for the pair.
Get up to 5% more foreign exchange by using a specialist provider to get closer to the real market rate and avoid the gaping spreads charged by your bank when providing currency. Learn more here.