- GBP/INR has pulled-back after touching our upside target at 94.00
- Pound's main release in week ahead is first quarter growth data on Friday
- The Indian Rupee will probably take its cue from fluctuating oil prices

© Rawpixel.com, Adobe Stock
GBP/INR continues making higher highs as fears of rising oil prices undermine the Rupee - next stop 95.00.
At the start of the new trading week one Pound buys 92.85 Rupees on the interbank market as the exchange rate establishes itself above the 90.00 watershed.
Rising oil prices - which some think may now reach three figures (ie $100/br) - would likely be the main fundamental catalyst behind such a weakening in INR as India is heavily dependent on imported oil (it needs to sell Rupees to buy it).
From a technical point of view, GBP/INR presents traders with mixed signals: on the one hand the uptrend continues apace but on the other hand, early signs of decline still stalk the charts.
Since price-action is pre-eminent above all other considerations and the uptrend dominates we are overall still bullish, regardless of accompanying bad omens.
The bullish case is that the exchange rate has now surpassed two major resistance levels which were acting as a glass ceiling preventing further gains - the 200-week moving average and the 2015 lows. These have now both been successfully cleared.
April 17 saw the pair break to new yearly highs of 94.36 just above our 94.00 target; since then the pair has pulled back to its current spot price of 92.78. A break back above 94.36 would provide confirmation of more upside to the next target at 95.00.

The main bearish sign is the possible ending diagonal pattern which may still be forming on the daily chart.
Ending diagonals occur right at the end of uptrends and are usually followed by high amounts of bearish volatility, as illustrated in the chart below:
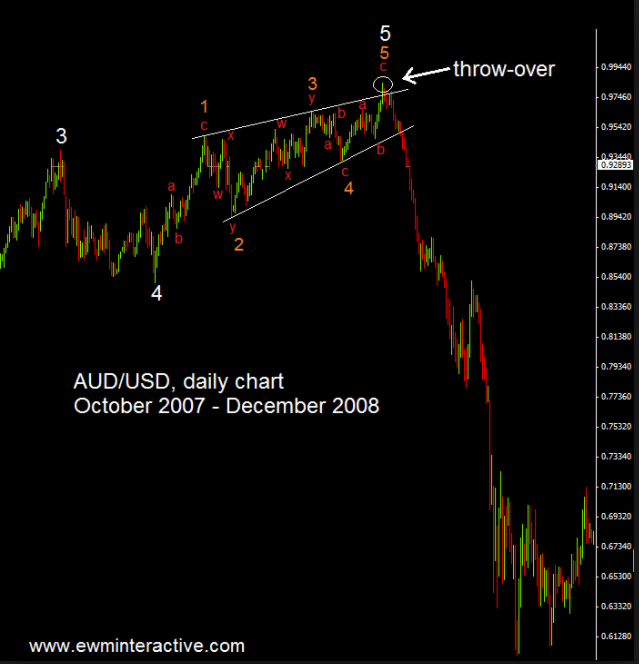
Although the breakout higher has diminished the likelihood the pattern is valid it has not cancelled out the possibility altogether, since as the chart above shows, the penultimate wave, or wave D often overshoots the upper border line of the diagonal, in what some analysts call a 'throw-over', as has happened in the case of GBP/INR.
On the weekly chart the exchange rate is showing another classic bearish sign in the form of the shooting-star Japanese candlestick pattern last week (see chart below).
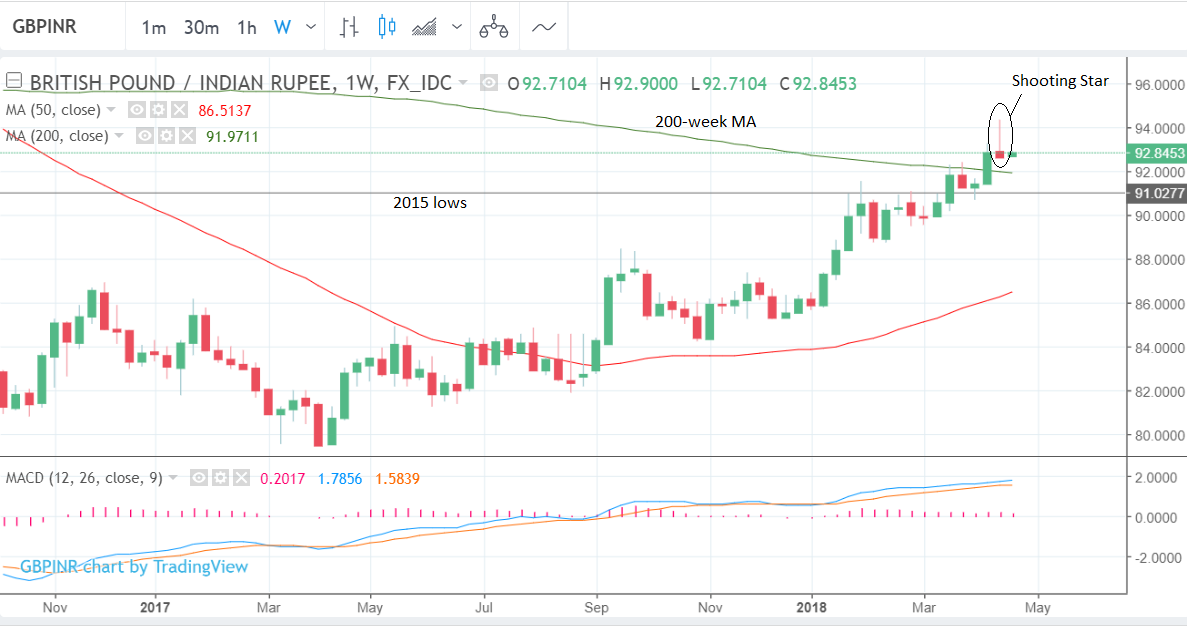
Shooting stars are short-term negative topping patterns, but they gain reliability from confirmation in the form of the following week being bearish, thus much depends on how bearish this week is before the strength of the signal can be assessed.
The monthly chart shows the pair trading at almost the exact same level as the 50-month moving average at 92.77 which appears to be acting as a ceiling, capping further price gains.
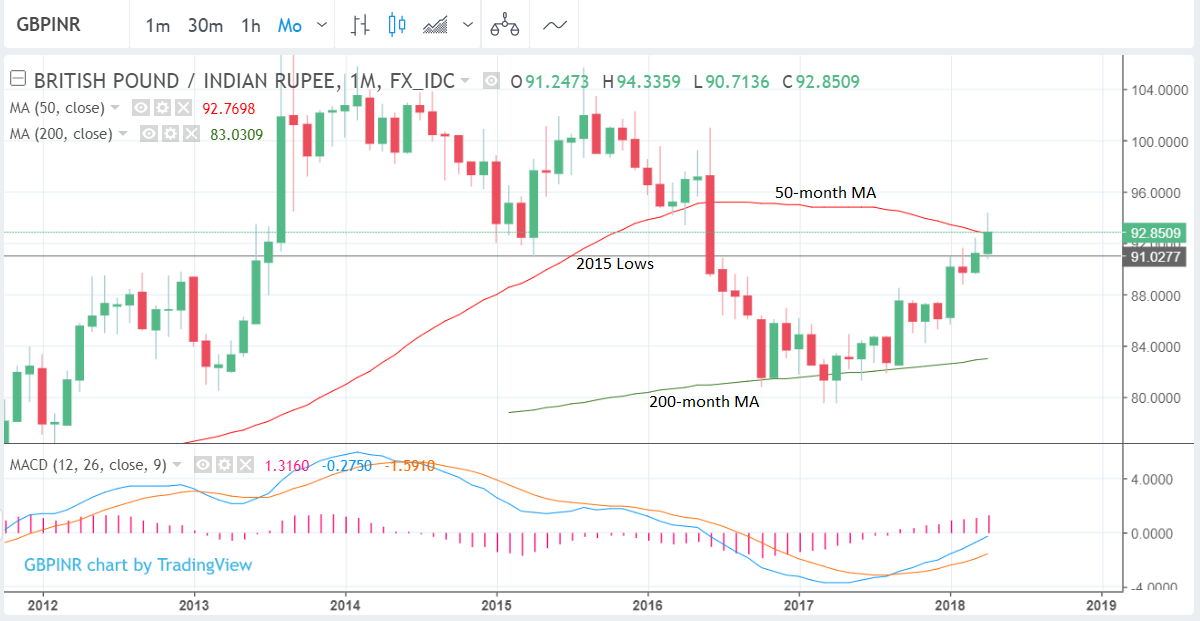
Large moving averages often act as obstacles to the trend as price action often stalls, pulls-back or even reverses at them due to the increased trading activity around them.
They are extremely popular indicators which many investors use to base their buying and selling decisions, thus supply and demand dynamics are often magnified around them.
Get up to 5% more foreign exchange by using a specialist provider to get closer to the real market rate and avoid the gaping spreads charged by your bank when providing currency. Learn more here.
Data and Events to Watch for the Rupee
The week ahead sees a spartan line-up of data releases for the Rupee and with only first-quarter GDP growth out on Friday for the Pound, economic drivers for GBP/INR may be in short supply.
Oil is a major influence on the Rupee because India has little of its own energy and so it needs to import a large amount of oil, thus changes in the price of oil can influence supply and demand of the Rupee.
Oil is currently rising and set to rise higher, which is Rupee negative and president Trump's anti-OPEC tweets can probably be dismissed as hot-air given the president is unlikely to have the reach to influence OPEC's decisions - a 14 country cartel made up of the world's largest oil exporters.
Saudi Arabia appears to be targeting 100 Dollars a barrel, which may be the reason behind the Rupee's dramatic decline to new highs above 94 Rupees to the Pound the week before last.
"Brent was last seen above the “USD70/bbl” mark and the technical charts are signaling that “U$80/bbl” is within reach. Saudi Arabia also opined that it hopes for crude to be closer to “$100/bbl” says Saktiandi Supaat analyst at Maybank.
"That had investors dumping India stocks and bonds for much of last week amid rising concerns that India’s current account would deteriorate further," continued the analyst.
"With the cheap crude bonus fading away for the Indian economy, Union Budget 2018 unlikely to provide much fiscal stimulus, hawkish RBI undermining the bonds and weak global risk appetite of late, the 1M USDINR NDF is poised to head towards the 67-figure and might even test the 68-figure within the next two weeks," concludes Maybank's Supaat.
Data and Events to Watch for the Pound
The Pound has the potential to be influenced by the continued debate over the Irish border and rumours that the government might embrace membership of the customs union post-Brexit to avoid undoing years of diplomacy in Northern Ireland.
If the rumours prove true it would almost certainly prove positive for Sterling as it would pave the way for a soft-Brexit.
UK GDP, out on Friday, is likely to undershoot expectations in Q1 due to the weather. The market seems quite well-prepared for a lower growth rate and only a gross undershoot would push Sterling lower.
Get up to 5% more foreign exchange by using a specialist provider to get closer to the real market rate and avoid the gaping spreads charged by your bank when providing currency. Learn more here.