
Image © Natanael Ginting, Adobe Stock
- GBP/INR now in short-term bearish downtrend
- Break below 93.47 needed for continuation
- Brexit news to drive Pound; wholesale inflation the Rupee
GBP/INR could be pivoting and turning lower. The monthly chart shows how it formed a bearish 'gravestone doji' candlestick pattern at the October highs.
This is a very bearish sign and strongly suggests the pair may have a reversed trend. A break below the September lows at 91.23, although a long way off, would confirm a change of trend and the birth of a new bearish longer-term downtrend.
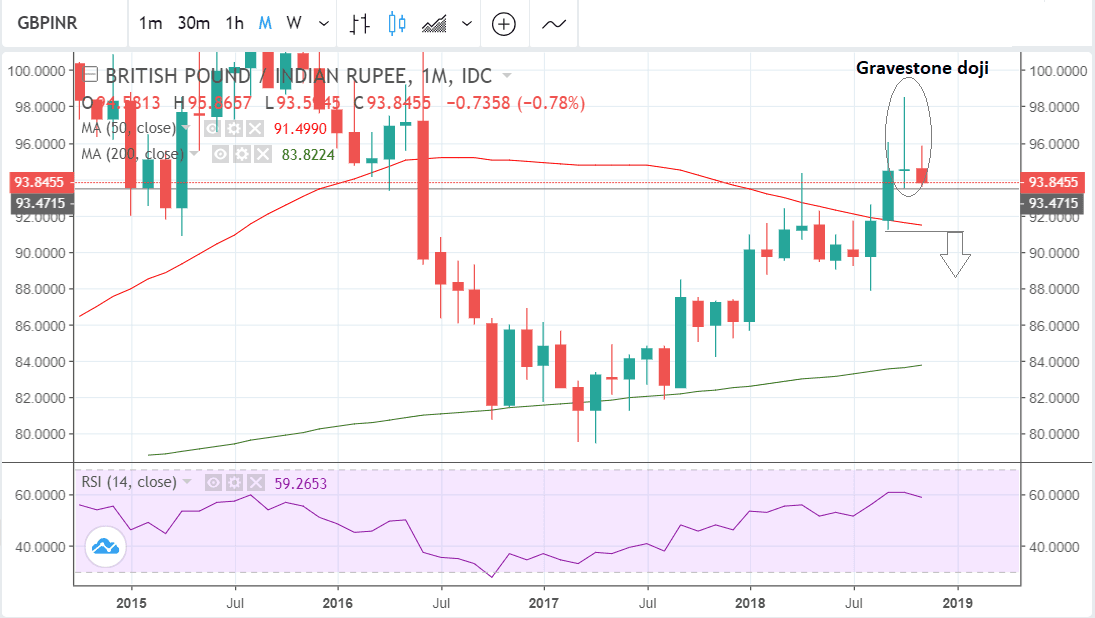
The move down since the October highs has probably already established a short-term downtrend. Four out of the last five weeks have been negative. It suggests the exchange rate is more prone to falling in the short-term.
The 4-hr chart is also showing the pair is probably now in a short-term downtrend after reversing its sequence of rising peaks and troughs and starting a new sequence lower. It has formed over two lower lows and lower highs which is the first indicator that the short-term trend is changing.
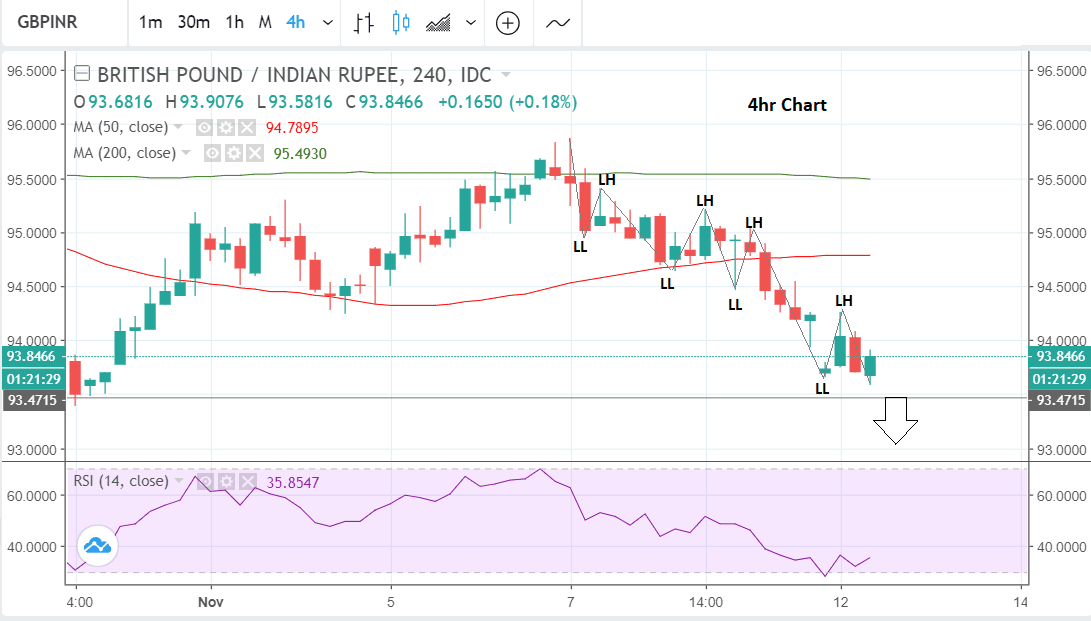
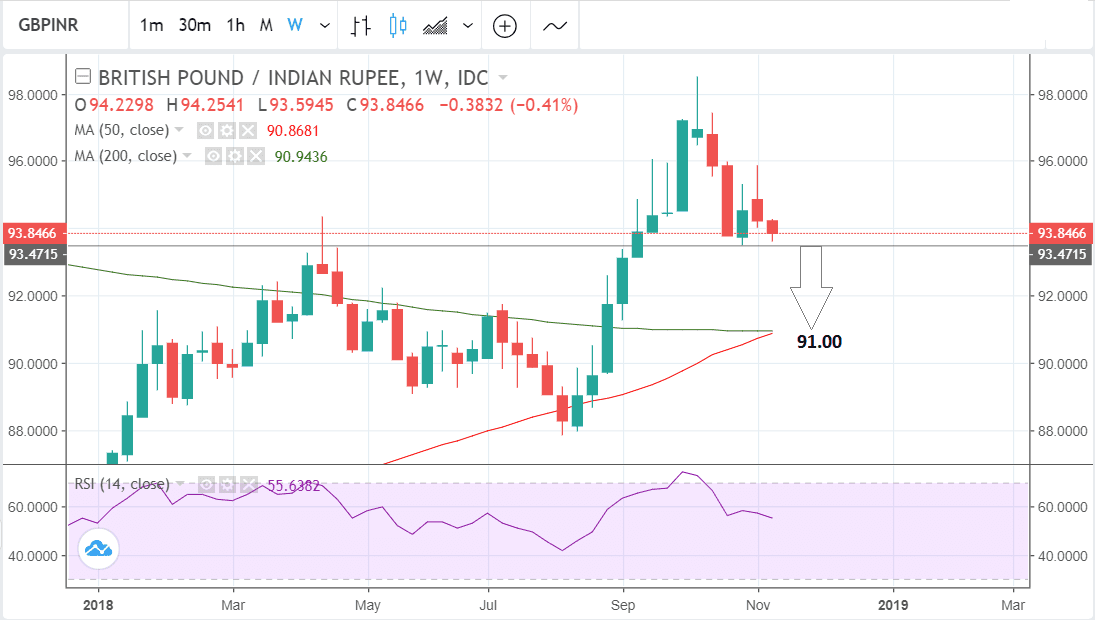
A key support level lies at 93.47 and this could provide a floor for the exchange rate which may stall or temporarily bounce when it meets it. Eventually, however, we expect a continuation lower on the condition that the exchange rate can successfully break below 93.45.
Such a move might be expected to fall all the way down to the 50 and 200-week MAs situated at around 91.00.
Advertisement
Bank-beating GBP/INR exchange rates: Get up to 5% more foreign exchange by using a specialist provider to get closer to the real market rate and avoid the gaping spreads charged by your bank when providing currency. Learn more here
The Rupee: What to Watch
The main release for the Rupee in the week ahead is inflation data, which has already been published on Monday morning, and showed a 3.31% rise year-on-year (yoy) in October, compared to the 3.7% rate previously.
The fall in inflation was mainly driven by a drop in food prices, which declined 0.14% after gaining 1.0% in September. A drop in fuel prices as a result of lower oil prices was also seen as a factor.
The greater-than-expected fall in inflation data means inflation has stayed below the Reserve Bank of India's (RBI) 4.0% middle-of-the-target range level for four months in a row and will vindicate their decision to keep interest rates on hold at their last meeting.
Nevertheless, they remain ready to raise interest rates if necessary after altering their stance to "calibrated tightening" from the previous "neutral" at the same October meeting.
If inflation continues to slow down it could encourage the RBI to cut interest rates in the end, which would impact negatively on the Rupee. Lower interest rates are not as attractive to foreign investors seeking somewhere to park their cash, so the move could lower inflows.
Other data on Monday included manufacturing and industrial production in September which slowed down to 4.6% and 4.5% respectively, undershooting both previous results and expectations.
The next significant release for the Rupee is wholesale price inflation which is scheduled for release on Wednesday at 6.30 GMT and is forecast to show a 5.0% rise from 5.13% previously.
The price of oil is another key driver of the Rupee, and if the downtrend in crude continues it is likely to help the Rupee to appreciate as the trade deficit shrinks. India has to import most of its fuel so its currency is sensitive to fluctuations in the price of oil.
Advertisement
Bank-beating GBP/INR exchange rates: Get up to 5% more foreign exchange by using a specialist provider to get closer to the real market rate and avoid the gaping spreads charged by your bank when providing currency. Learn more here