
The GBP/EUR exchange rate remains vulnerable to another impulse lower according to evidence provided by technical studies.
Those looking to buy Euros might consider making the exchange now as our technical studies suggest this might be the last time we see current levels for a while.
The rebound in the Pound-to-Euro exchange rate on Monday reached a high of 1.1228 but has since faltered, and is currently trading back down at 1.1153.
The deterioration in the buying power of the Pound could be set to worsen further as the pair is tipped to continue falling according to a technical analysis of the charts.
Such an analysis highlights the space left by the gap which expanded (see chart below) when the pair opened trading considerably higher on Monday morning following a renewal of support for Theresa May's leadership.
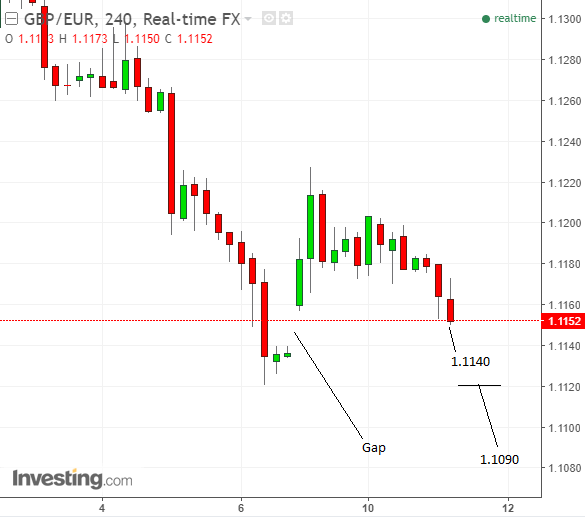
For technical analysts, gaps are important features on charts as they have a strong tendency to 'fill'.
This is what we are witnessing at the moment as the exchange rate moves below the 1.1157 level at the top of the gap - and there is now a good chance the pair will continue down to a target at 1.1140 to complete the 'fill'.
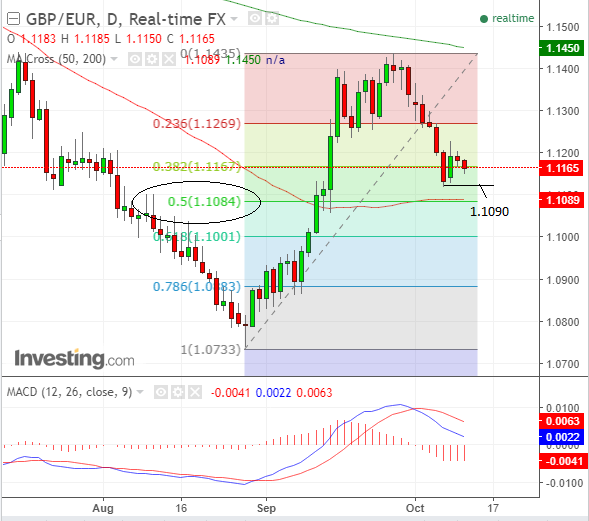
Panning out and we also note that the overall chart appears to support a generally bearish outlook.
The steep descent from the September highs is suggestive of a follow-on.
"Recent GBP strength here failed to establish prices back above 1.1450 (prior notable reactive peak) thereby effectively preserving the broader descending sequence," says Lucy Lillicrap, a technical analyst with AFEX, a foreign currency broker based in London.
We note the weak rebound on Monday is already being reversed and therefore see a strong chance of further loses going forward. A break below the 1.1119 lows would be useful as confirmation of more downside.
Assuming that level is broken, however, we would expect with a high degree of probability an extension down to 1.1090 where the 50-day moving average is situated.
The 50-day moving average will probably prevent more downside, at least temporarily, and could even be the staging post for a recovery rally, so it provides us with our next short-term target lower.
At around the same level is also the midpoint of the previous August-September rally - or the 50% level - which is another significant level on charts (circled).
This too would be expected to make it harder for bears to push the rate lower and is a further reason for seeing the 1.1090 level as a probable shrt-term target and the next battleground for the pair.
Get up to 5% more foreign exchange by using a specialist provider by getting closer to the real market rate and avoid the gaping spreads charged by your bank for international payments. Learn more here.