The Pound to Indian Rupee is in a broadly sideways trend longer-term, as illustrated by the weekly chart below, however, within that broad range it is showing a possible bullish reversal taking shape on lower time-frames.
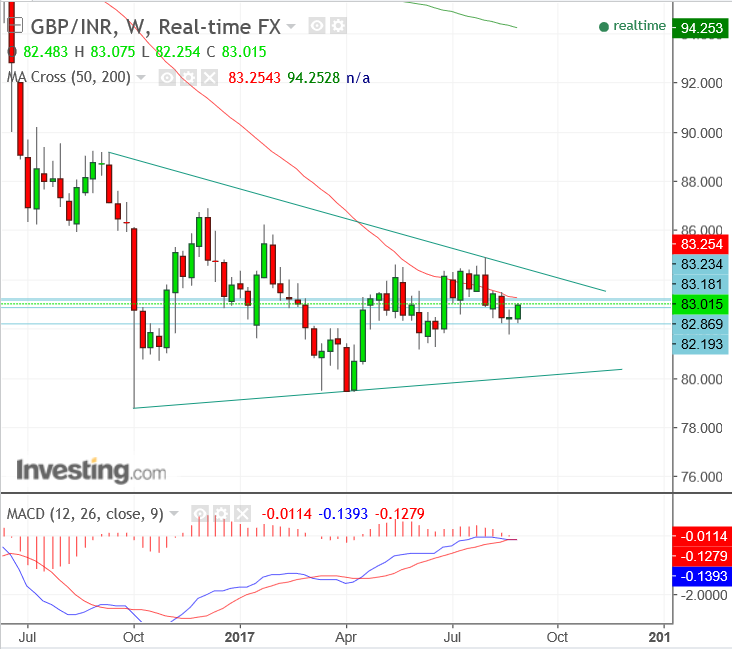
The move down from the 84.87 highs during August may have bottomed and a fledgling uptrend may be unfolding due to the strength of the bounce which began at the August 24 lows.
The four-hour chart illustrates just how strong the rebound has been and also how the sequence of peaks and troughs has changed from down to up.
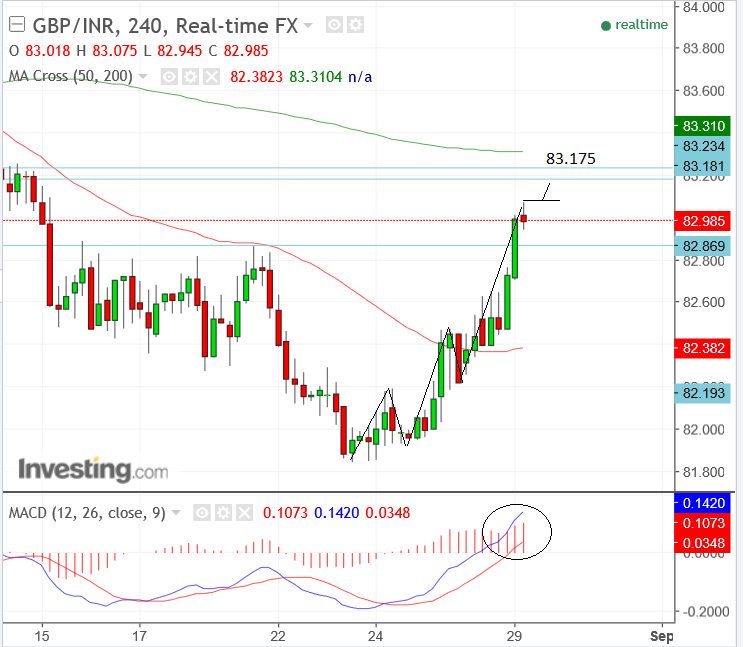
The pair has broken above the key 82.86 highs and the MACD momentum indicator is now above the zero-line, indicating the trend has turned higher.
We expect this strong young uptrend to extend higher, with a move above the 83.075 highs confirming a continuation higher, to a target at 83.175, where there is a cluster of resistance levels.
The 50-week moving average is situated at 83.250 and the 50 and 200-day moving averages are at 82.200.
Moving averages are used by traders to gauge the trend and represent long-term value, however, they are also dynamic levels of support and resistance, and, therefore, can act as tough obstacles to the trend.
We expected the cluster of MAs between 82.20-25, to resist gains in the case of GBP/INR.
The Economy Forecast Agency website, is also bullish the pair, saying that it expects GBP/INR to rise to a target of 82.50 in a week's time - i.e. by Tuesday September 5.
"In 1 week, Pound to Rupee forecast on Tuesday, September, 5: exchange rate 82.50 Rupees, maximum 83.74, minimum 81.26," said the website.