Image sourced Flickr, reproduced under CC licensing
- GBP/INR enters downtrend after H&S pattern forms.
- Market correcting higher but likely to resume decline.
- Rupee to be driven by oil prices and falling inflation.
The Pound-to-Rupee rate was trading around 85.85 Monday afternoon after falling almost half a percent so far this week, and studies of the charts suggest the exchange rate will probably move lower in the short-term if the July 10 low gives way.
The 4-hour chart, which we use to determine the short-term outlook covering the next 5 days, shows the pair having broken below the ‘neckline’ (circled) of a large topping pattern called a 'head and shoulders' (H&S) with extremely bearish implications for the exchange rate.
GBP/INR has corrected higher since making a low at 85.20 on July 10 but this pullback looks rather shallow and weak. Absent a recovery above the 92.00 level, and given the pattern discussed above, the pair will probably resume its descent sooner or later
The next bearish leg lower is likely to be about the same length as the leg which began at the 23rd of June highs, which suggests a final downside destination of 83.00.
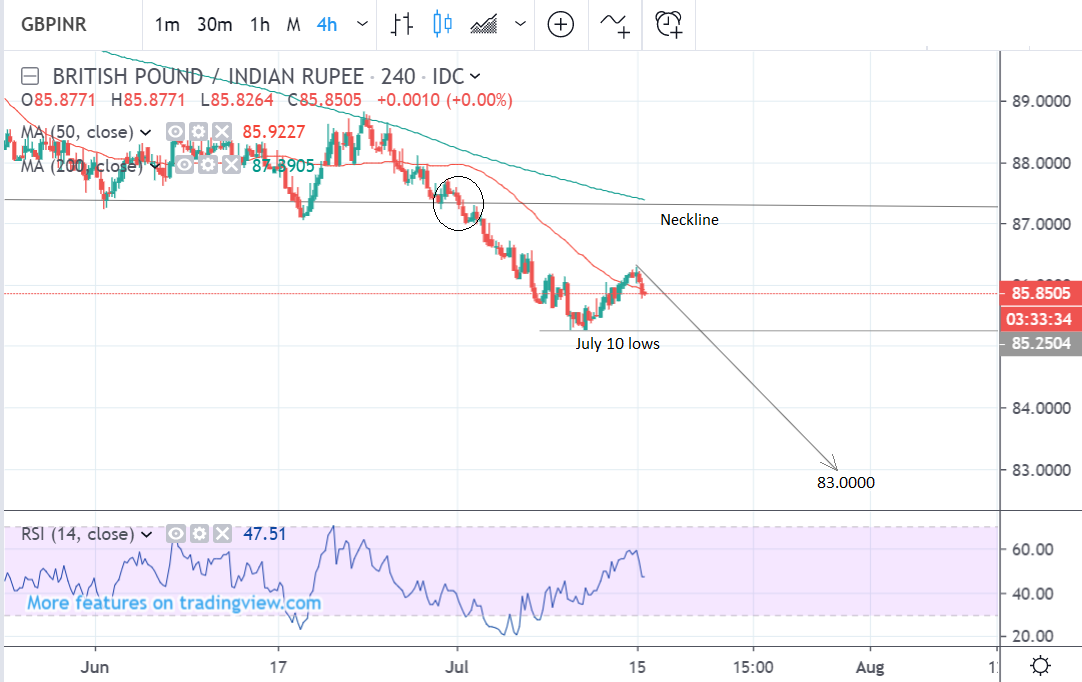
Above: Pound-to-Rupee rate shown at 4-hour intervals.
The daily chart shows the pair in an established downtrend that is biased to continue lower.
The prognosis is much like that of the 4hr chart in that a break below the July 10 lows will lead to a move down of a similar length to the first bearish leg from the June highs, which implies a target of about 83.00.
Assuming the pair falls to 83.00 it may stall for some time as traders take profit on their bearish bets and the market pauses for a ‘breather’. At that point, the pair may go sideways between roughly 83.00 and 84.00.
The daily chart is used to analyse the short-term trend, which is defined as the outlook over the next one-to-four weeks.
.png)
Above: Pound-to-Rupee rate shown at daily intervals.
The weekly chart also shows the bearish H&S topping pattern, which is normally a very negative sign. It is composed of three peaks - a head and two shoulders. A break below the neckline triggers the subsequent decline.
The pair has now definitely broken below the neckline suggesting it will continue lower until it reaches a possible eventual end target at 80.75, calculated by taking the height of the pattern at its tallest and extrapolating it down.
A break above the red trendline would negate the bearish forecast. The weekly chart is used to analyse the short-term trend which is defined as the outlook over the next one-to-four months.
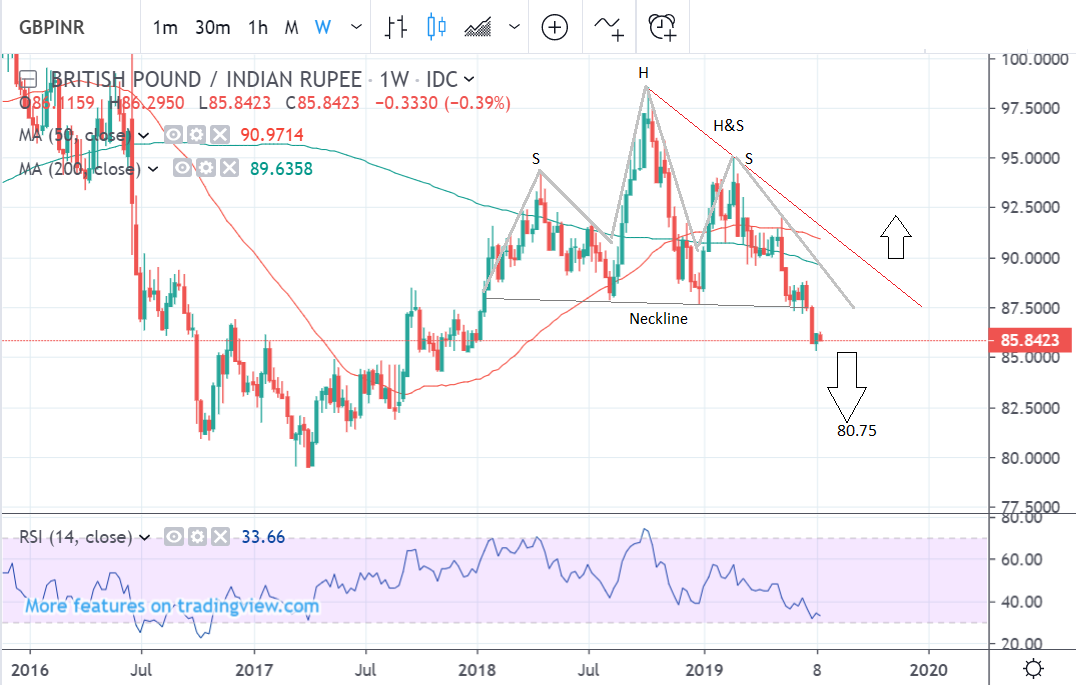
Above: Pound-to-Rupee rate shown at weekly intervals.
AA
The Rupee: What to Watch
The main fundamental driver of the Rupee in the short-term is likely to be the price of oil.
Fluctuations in the price of oil have been found to directly impact on the Rupee. Oil accounts for a third of all imports into India so when oil prices rise it increases the Indian trade deficit, putting pressure on the Rupee. It also depletes foreign exchange reserves and transfers wealth from India to oil exporting nations.
The main release for oil in the short-term is API crude oil inventories on Thursday at 21.30. If the trend for bigger inventory draws persists it could push up the price of oil, which in turn would weigh on the Rupee.
WTI crude broke above the key $60.00 level last week after rising demand and geopolitical tensions supported prices. Tensions in the gulf are a bullish driver for oil as Iran, one of the largest producers is prevented from exporting due to sanctions.
There is a risk the sabre-rattling between the UK and Iran could escalate and further drive up oil prices. Recently the UK stopped a Iranian tanker in the Straits of Gibraltar and Iran retaliated by threatening a UK tanker in the Gulf of Hormuz.
The link between oil and the Rupee seems to be backed up by evidence from academic researchers. In “Crude Oil prices and the exchange rate in India,” authors Sharma, Rishad and Kumar conclude that there is a verifiable causal link.
"The results of Granger non-causality test indicate that there is a unidirectional causality running from oil price to exchange rate, not vice versa. This result is substantiated by the movement of Rupee exchange rate during the period of study," say the paper’s authors.
On the domestic data front, the main release this week has already been published in the form of wholesale price inflation, which was out Monday. The data showed a deeper-than-expected fall in Indian wholesale goods inflation to 2.02% in June, from 2.45% previously, when a drop to 2.35% had been expected.
Lower-than-expected wholesale inflation is likely to feed through to weaker consumer prices more generally, which could then inform the debate about whether the Reserve Bank of India (RBI) is likely to cut interest rates again.
Such a move would be negative for the Rupee as it would reduce net capital inflows by making India less attractive as a place for foreign investors to park their money. If the trend in lower inflation continues to might become a negative influence on the Rupee longer-term.
.png)
Above: Indian wholesale price inflation. Source: Trading Economics.
Time to move your money? Get 3-5% more currency than your bank would offer by using the services of foreign exchange specialists at RationalFX. A specialist broker can deliver you an exchange rate closer to the real market rate, thereby saving you substantial quantities of currency. Find out more here.
* Advertisement