Image © Bank of Canada
- GBP/CAD rises strongly after repricing Brexit news
- Canadian Dollar also weakens after oil price declines
- GBP/CAD poised to start new short-term uptrend
The Pound-to-Canadian Dollar exchange rate was the strongest G10 Sterling pair on Thursday trading 0.9% higher on the day with the pair quoted at 1.7212 on Friday, February 08.
The Pound strengthened overall on the news the EU had conceded to renegotiating the Brexit withdrawal deal, and after the labour party indicated a greater willingness to work in a more bipartisan approach with the government.
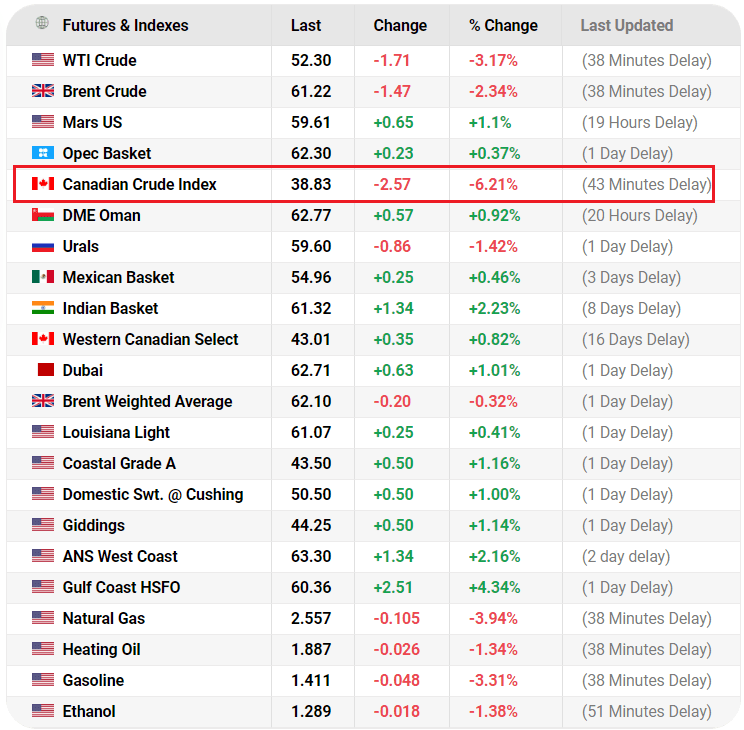
Of all the G10 pairs, the Pound rose most versus the Canadian Dollar because of idiosyncratic factors weakening CAD. A reversal in the price of crude oil, especially the Canadian Crude Index, which had declined by more than 6.3% in a day - more than any other major variety.
Other benchmarks were less impacted although WTI still fell a considerable 3.2% and Brent declining by 2.3%.
Oil exports make a substantial contribution to Canada's foreign exchange earnings, so changes in its price often impact on the supply and demand of its currency.
The recent decline comes amidst fresh disappointment in the China-U.S. trade war front, with U.S. President Donald Trump refusing to meet his Chinese counterpart Xi Jinping before a March 1 deadline for the U.S. to reach a trade deal with China.
Trump had stoked expectations of an upcoming summit with Xi just last week, when he said that no trade deal would be reached with China until the two presidents met “in the near future” to agree on the “more difficult points” in their economic relationship.
On Thursday, however, Trump answered "no" and shook his head when asked by reporters in the Oval Office if he would meet Xi before the deadline.
It is thought that if tariffs rise it will trigger an even deeper global and Chinese slowdown and part of the response will be a reduction in the demand for crude oil.
Yet contrary to this view is the alternative view that oil prices could actually rise due to the possibility that the OPEC and the Russian oil alliance could come together and form a larger oil cartel, commentators are calling OPEC+; and that this would have even more power in controlling the price of oil.
OPEC+ is expected to officially form at a meeting this February and if the new merger also agrees more widespread supply constraints in order to drive up oil prices, the price of oil could pivot higher.
There are opponents to the OPEC+ merger including Iran which is afraid of being supplanted in second place by Russia and the U.S. which is also against such a merger because it would consider OPEC+ a monopoly which would go against its anti-trust legislation.
From a technical perspective the outlook for oil has just turned negative on a short-term trend basis.
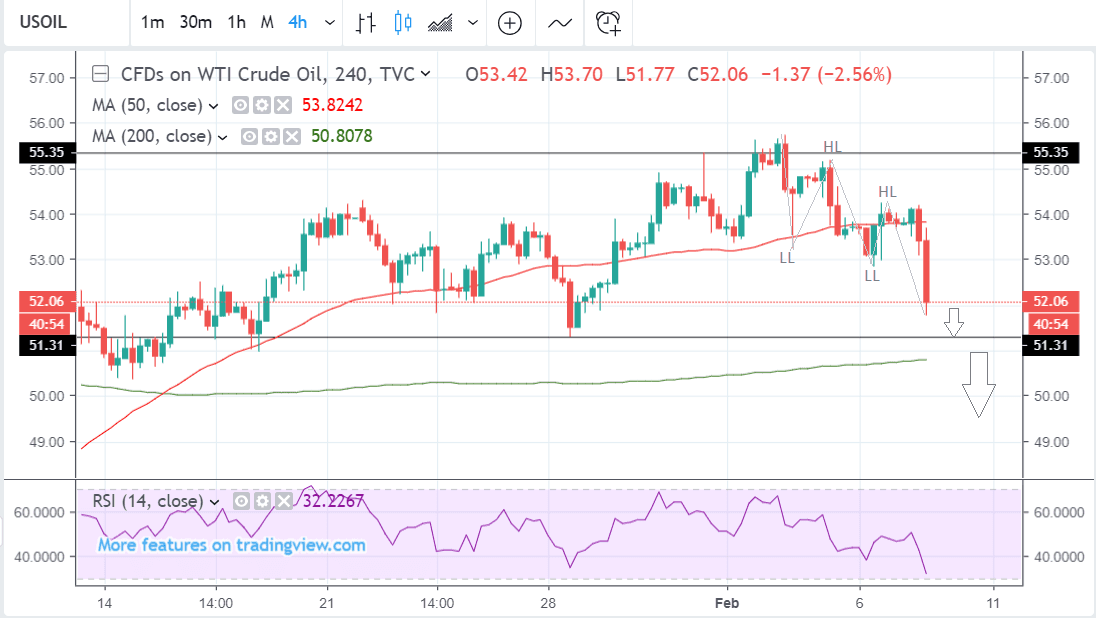
The price of oil (WTI) has completed two lower lows (LL) and two lower highs (LH) and this is the first sign of the beginning of a short-term downtrend.
The immediate outlook is for the exchange rate to come down to support at 51.30 initially and then perhaps even lower afterwards.
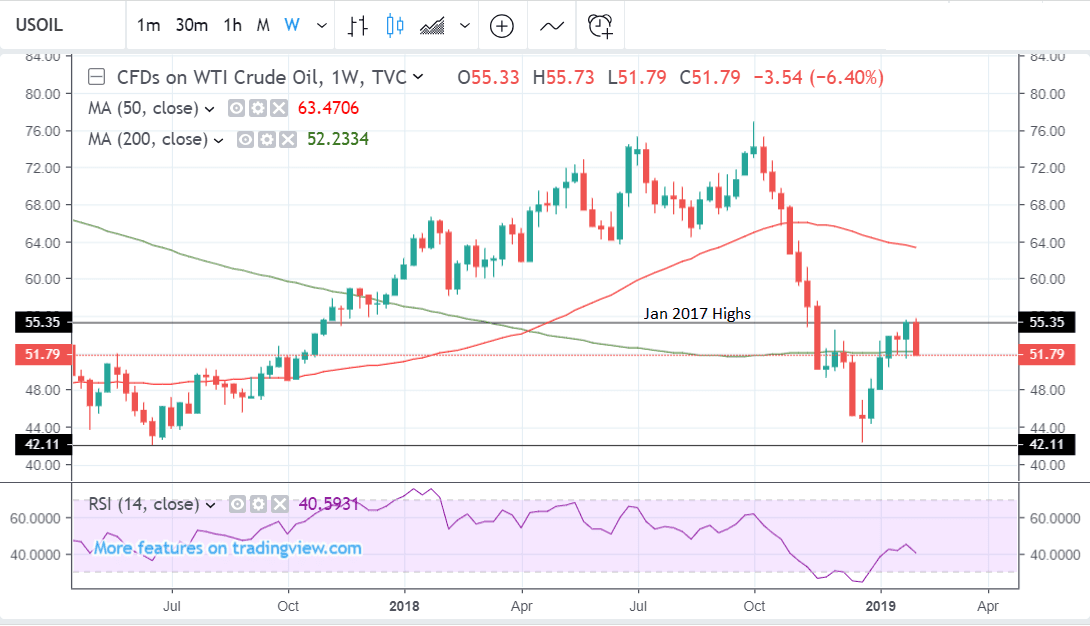
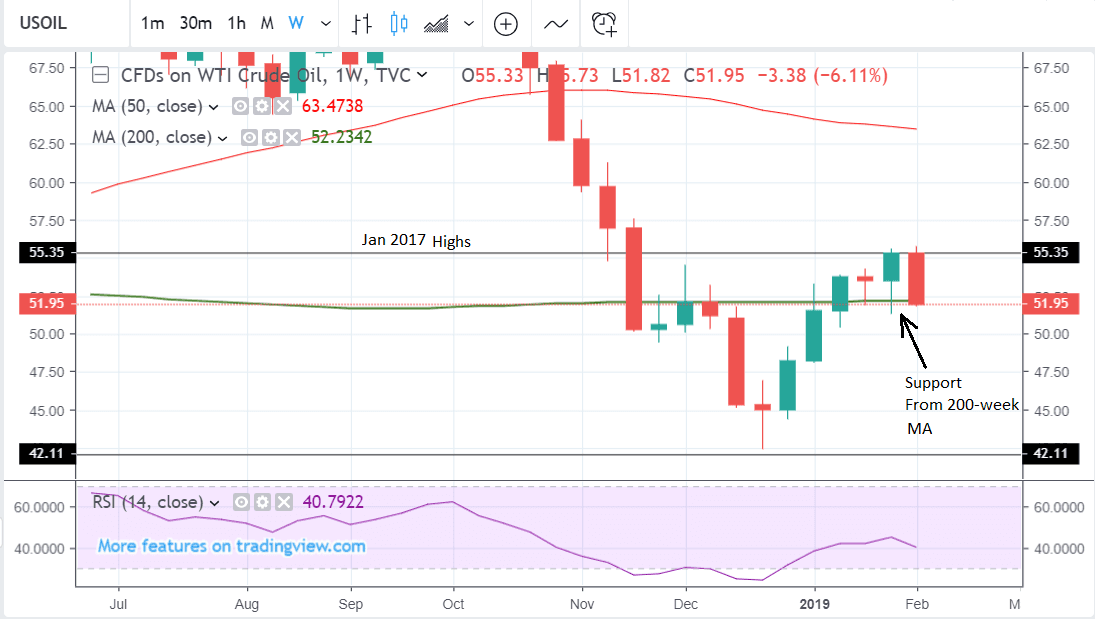
Longer-term the outlook is less clear because the oil price is meeting solid support at the level of the 200-week MA at $52.23 which is likely to act as a hard floor.
Ultimately the 200-week MA would have to be breached to produce a much weaker technical outlook, and this could be problematic given it is such a tough obstacle.
Pound Turns Positive Against the Canadian Dollar
The recent sharp sell-off in the price of oil is mirrored in the rise in GBP/CAD, and although the strong thrust higher is a positive sign for the outlook for the pair it remains a little early to forecast a complete reversal in the short-term downtrend, and risks remain that the pair could continue to the downside.
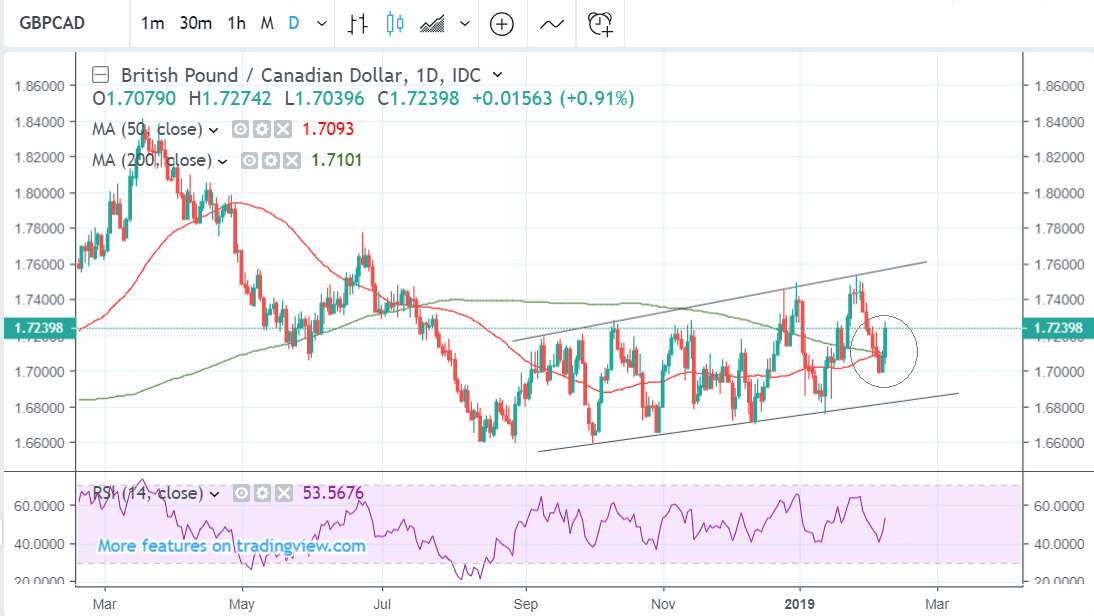
One bullish sign, however, is that the pair rotated at the level of the 50 and 200-day MAs at circa 1.71 and this suggests this level is a strong floor. Major trends often pivot at the level of the 50 or 200 moving averages which have a special significance for markets.
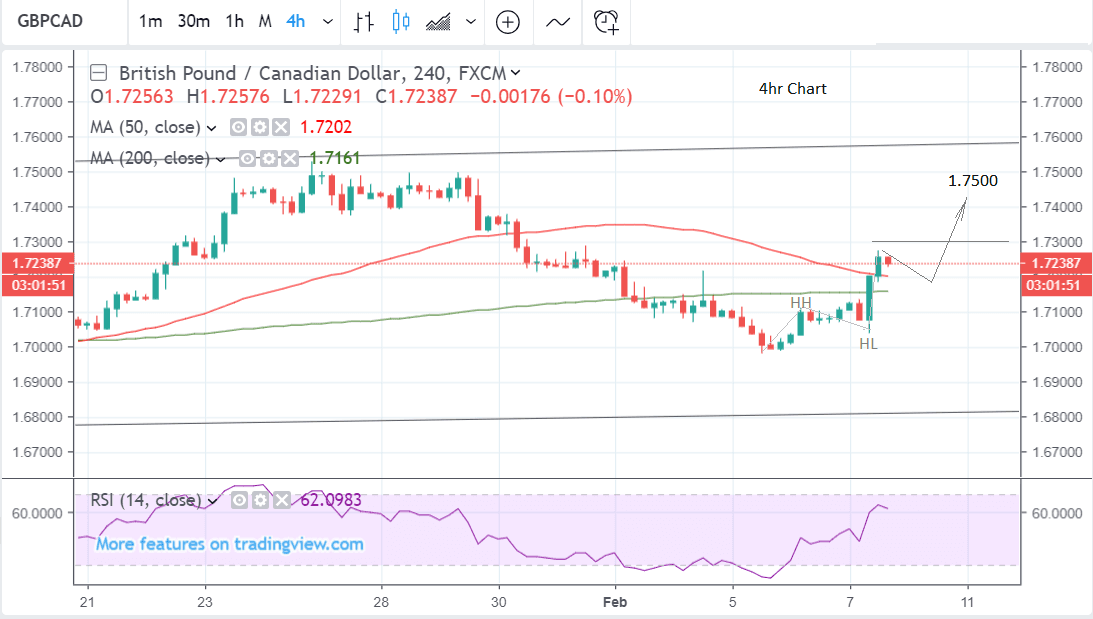
The 4hr chart above shows how the exchange rate thrust higher after touching the 1.71 lows, but still, nevertheless remains too underdeveloped to signal the birth of a new uptrend.
It has only formed one set of higher highs (HH) and higher lows (HL), so far, and this is insufficient to signal a continuation higher. It would probably take a break above the 1.73 level to confirm a new uptrend, as well as at least two consecutive higher highs and higher lows.
If that was the case we would forecast a move up to an immediate target at circa 1.7500, at the top of the pair’s long-term range.
Time to move your money? Get 3-5% more currency than your bank would offer by using the services of foreign exchange specialists at RationalFX. A specialist broker can deliver you an exchange rate closer to the real market rate, thereby saving you substantial quantities of currency. Find out more here.
* Advertisement