
Oil at Critical Level; Looks Vulnerable to Breakdown
The price of crude oil fell 9% last week as inventory data showed stockpiles rising whilst data from futures exchanges showed a record high number of long or buy positions.
The mismatch of bullish trader sentiment with the statistics of oversupply led to a rapid unwinding of those record long positions and a steep backslide in the price of crude.
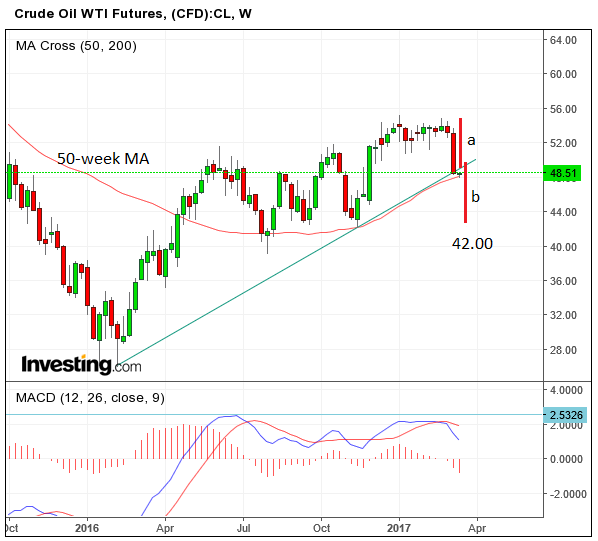
Oil has now reached a key tipping point on the price chart, signalling the possibility that unless it holds its current line, further, much deeper declines could be imminent.
Weaker oil prices are likely weigh on the currencies of major producers such as the Norwegian Kronor (NOK), the Rouble (RUB) and the Canadian Dollar (CAD).
On the other hand, major oil importers could find their currencies supported by a decline in price, such as the Indian Rupee (INR) and the Japanese Yen (JPY).
Piercing Trendline
The commodity has fallen to a major trendline drawn from the 2016 lows and today (Monday) sees activity for the first time occurring below the trendline, potentially indicating a break has happened.
Whilst it is too early to say for sure, if a break has occurred it could leave oil extremely vulnerable to significant future losses, and forecasts a decline to a target at 42 dollars a barrel.
According to technical analysis theory, when the price of an asset breaks below a trendline it tends to follow-through on the other side the same distance as the move prior to the break.
On oil the price fell about 6 dollars in the steep sell-off prior to today’s trendline break at 48 dollars, this is labelled ‘a’ on the chart below. It would therefore be expected to fall roughly the same amount below the trendline – giving a target of 42, in a move labelled ‘b’.
The one major technical factor that crude bulls can take hope from is the position of the 50-week moving average at just below the level of the current day, at 42.30.
Large moving averages such as the 50-week often stay trends and can lead to significant turnarounds and recoveries, however, the bearish look and feel of the chart suggests to us that this level will not hold and oil will eventually tumble lower.
The 200-day moving average is just above the current level at 49.00 on the daily chart (not shown) and could also hold up prices and potentially signal a reversal, however, once again our view remains bearish.
Oil bears will be hoping the current breakdown is a sign of a structural change in the oil market, whilst oil bulls will be hoping it represents a ‘flushing out’ of a record high position of oil future longs, as per last week’s commitment of trader’s data.
OPEC vs Shale
Oil fundamentals point to the clash between OPEC and US Shale Operators coming to head which could indicate a change in the ‘structure of the market’ may be the cause of the malaise, according to analysis from Market Pulse’s Jeffrey Halley.
Halley points to a surge in Shale operations since oil broke above the 50 Dollars a barrel, the price at which Shale becomes profitable to extract.
“It is the ramp-up in U.S. shale that has really caught the world and OPEC on the hop. The Baker Hughes Rig Count showed yet more of those fracking rigs (sic) added last week, with the U.S. rig count hitting 768, up from 480 a year ago. The ability of shale to be profitable above $50 a barrel despite the prices of the best shale acreage exploding in price is impressive. Given their pace of innovation, they may well be profitable at much lower levels than that. Something to cause sleepless nights at OPEC’s HQ in Vienna,” said Halley.
Apart from this OPEC has been dogged with a lack of cohesiveness in cutting supply.
It seems earlier overtures of compliance were overexaggerated, as the reality is much more chaotic, Halley argues.
“They’ve (the Saudis) not had much help from their OPEC and non-OPEC allies. Producers such as Libya and Nigeria were given a leave pass from the deal altogether. The Iraqis and Iranians both ramped up production ahead of the cut start date and have signaled they have plenty of production ammunition ready to go when it rolls off. The Russians, the world’s largest producer daily at some 11 million barrels a day (bpd), have managed to cut a paltry 150,000 bpd of their target of 300,000 bpd and we are three months into the reduction period. Thanks for nothing guys,” noted the analyst.
Another factor which OPEC should be concerned about is how many of the record speculative oil longs were bought by shale operators to hedge the possibility of crude falling below the 50 buck tipping point at which theur operations make a loss.
If many of the oil future longs were indeed from Shale operators to insure against a fall in the price then they will likely have deeper pockets than thought and could be able to weather a decline more easily than previously.
This in turn could keep supply elevated, leading to even deeper declines.
BofA See Demand Outstripping Supply and Eventually Stabilising Prices
Analysts at Bank of America are less bearish for Oil, seeing the price recovering due to rising global demand quickly outstripping demand.
They point out, for example, that while the data which triggered the rout showed higher inventories in the US, the most recent data for the OECD as a whole saw stocks falling.
This, along with forecast rising demand is likely to keep oil prices supported.
“Given our expectations of a global deficit of 575 thousand b/d this year, we expect a further 210 mn bbl total draw in 2017,” said BofA.
They see a pick-up in US exports and a widening in Brent to West Texas spreads as a necessary pre-requisite for rebalancing.
“The key to the rebalancing of global oil markets is a surge in US oil exports, in our opinion, as it will help clean up the large North American surplus.
The ramp up is already underway. But to clear the global glut, Brent-WTI spreads at the prompt may need to widen further. With global oil demand still very firm, we still see spot oil prices moving higher,” added BofA.


