A chart-based quantitative strategy which uses moving averages to forecast currency pairs is signalling more downside for some of the major oil currencies, say Citibank in a note to clients.
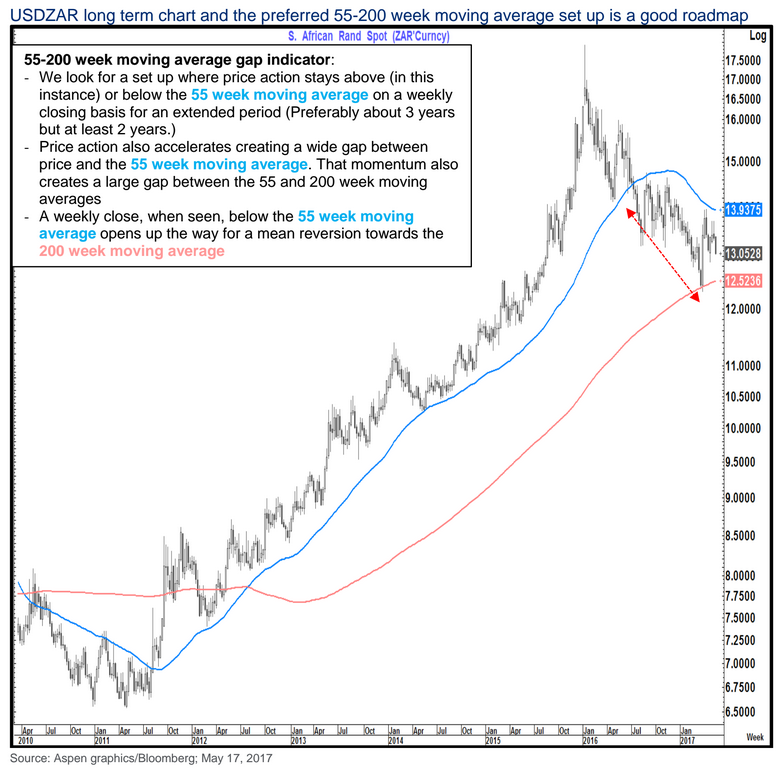
The strategy is particularly clearly exemplified on the chart of USD/ZAR.
The strategy operates best in a strongly trending market where price action has remained above the 55-week moving average (MAV) and the 200-week MAV for a fairly lengthy period of time of 2, preferably at least 3 years.
The ideal set-up then occurs when price action and moving averages have fanned out from each other.
This happens when price action moves substantially away from the 55 MAV, and the 55 MAV moves substantially away from the 200 MAV.
“Price action also accelerates creating a wide gap between price and the 55 week moving average. That momentum also creates a large gap between the 55 and 200 week moving averages,” said Citi’s Tom Fitzpatrick.
The next thing to note is if the price action then moves down rapidly from its peak and finds its way down to the 55-MAV.
A weekly close then below the 55-MAV is the trigger point for further downside.
The strategy then forecasts a continuation down to the level of the 200-MAV.
“A weekly close, when seen, below the 55-week moving average opens up the way for a mean reversion towards the 200-week moving average,” said Fitzpatrick.
Although not strictly classed as an oil currency the Rand is a commodity currency as it exports many natural resources.
It shares many of the characteristics of oil currencies and tends to move in trends similar to them.
The strategy that works on USD/ZAR is, therefore, likely to hold true for other commodity or oil pairs.
It seems most clearly visible on USD/MXN where the exchange rate has only just breached and closed below the 55-day MAV.
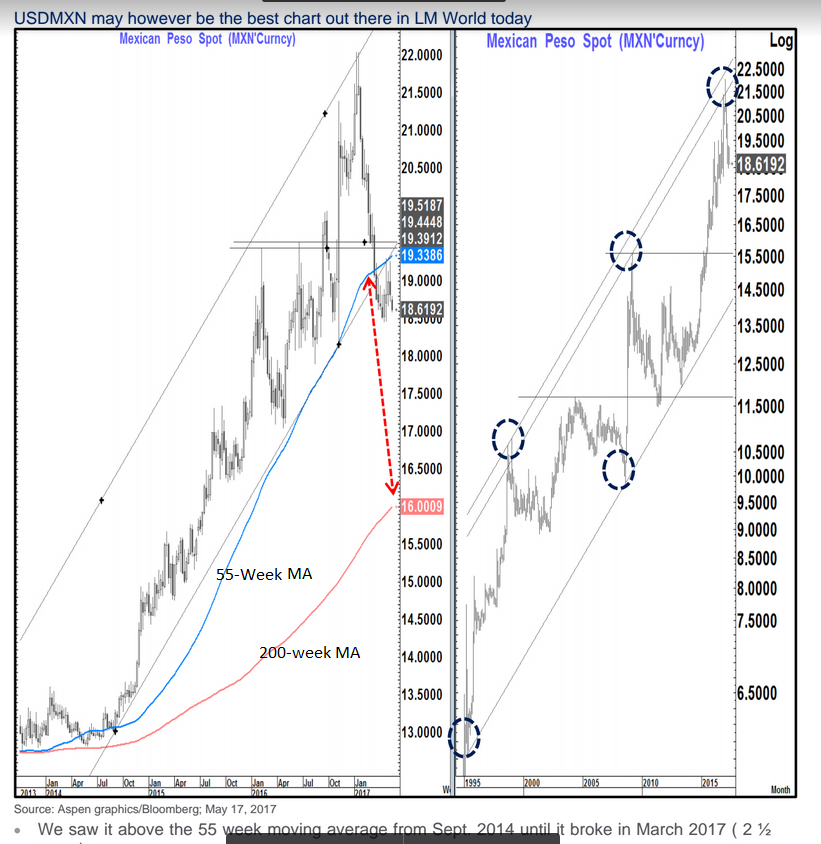
On USDMXN we see the possibility of a move all the way down to the 200-week at 16.009.
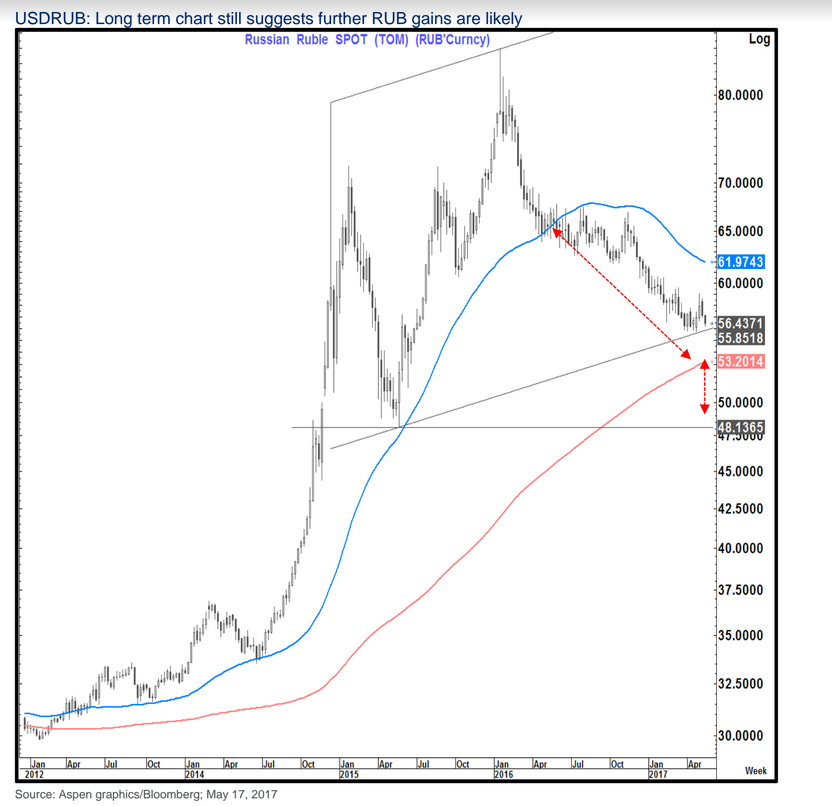
The Rouble is also showing the potential for a move down from the current 55s to 53.20.