- GBP/ZAR breaking lower toward December 2019 levels
- USD/ZAR closes on November 2021 low post-U.S. CPI
- Ebbing core CPI a headwind for USD/ZAR & GBP/ZAR
- Soothing U.S. bonds & bolstering ZAR’s relative appeal
Image © SARB
The South African Rand outperformed early this week and its breakout advance against the U.S. Dollar is further significant because it potentially places GBP/ZAR on course for its lowest level since December 2019.
South Africa’s Rand rose against most in the G20 collection on Tuesday with only the Brazilian Real and Turkish Lira out ahead after official data revealed a hint of what may now be an ebbing U.S. core inflation pulse.
The main U.S. inflation rate rose by a record 1.2% in March, taking the annual rate to 8.5% and its highest since the period ending in December 1991, but core inflation fell from 0.5% to 0.3% in month-on-month terms and was also slower than financial markets had anticipated.
“The sharp jump in the headline figure to over 8.0% y/y bolstered market expectations for a 50bp hike at May’s FOMC meeting,” says Annabel Bishop, chief economist at Investec.
Many might have expected Tuesday’s eye watering annual inflation rate to have stoked greater market appetite for the Dollar or come at a cost for many other currencies but U.S. exchange rates were lower almost across the board following the data and the Rand was building further on earlier gains.
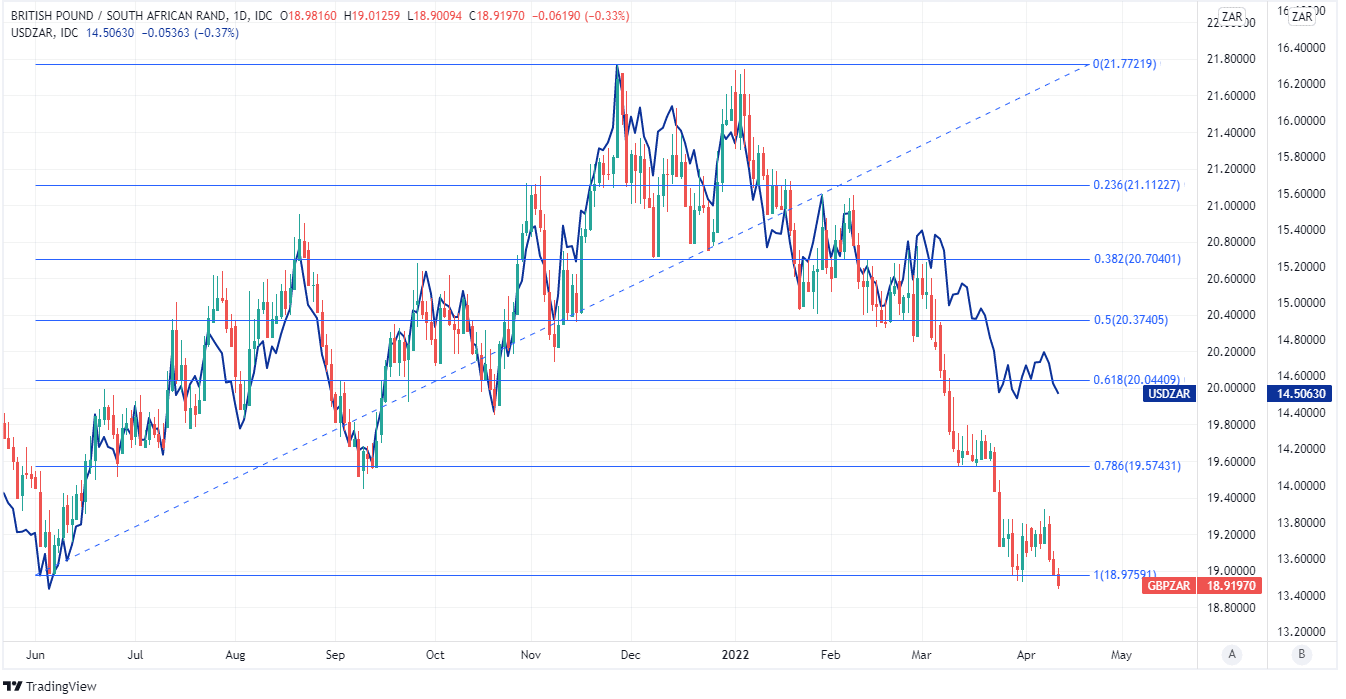 Above: GBP/ZAR at daily intervals with Fibonacci retracements of June 2021 rally indicating possible areas of short-term technical support for Sterling, and shown alongside USD/ZAR. Click image for closer inspection.
“The higher-than-expected headline number should give rise to greenback strength as it is likely to force the US Federal Reserve into a more aggressive hiking cycle,” says Ryan Booysen, a managing director at DG Capital Forex.
Tuesday’s waning core inflation number may be indicating the beginning of a statistical trend in which a slowing pace of month-on-month inflation eventually acts to bring down the annual rate of overall U.S. inflation too.
Similar was seen in the Personal Consumption Expenditures price index figures released in late March, which showed the Fed’s preferred measure of core inflation rising at a slower pace than it had in February.
“This is expected to be the last of the inflation jumps, with base effects and some lower commodity prices soothing inflation over Q2.22,” Investec’s Bishop also said on Tuesday.
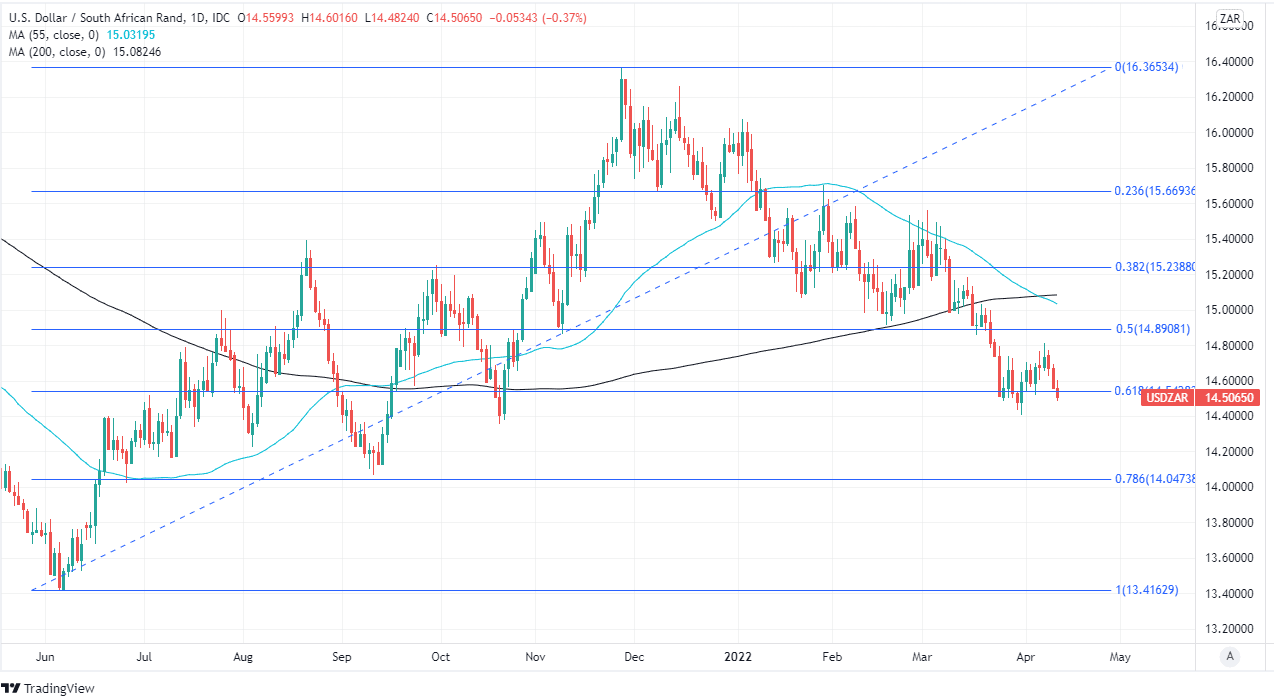 Above: USD/ZAR shown at daily intervals with Fibonacci retracements of June 2021 uptrend indicating possible areas of short and medium-term technical support for USD. Includes bearish moving-average crossover. Click image for closer inspection.
Core inflation rates ignore volatile and internationalised energy and food costs when measuring changes in prices, and so are often viewed by central bankers as a better gauge of domestic inflation pressures than the overall inflation rate.
The beginning of any ebbing trend in the month-on-month numbers could eventually have a moderating impact on market expectations for U.S. rates, which could in turn eventually act as a headwind for the Dollar and a supportive factor for Rand exchange rates.
“We expect ZAR to continue to appreciate, now targeting USDZAR at 14.25 by the end of Q2,” writes Eimear Daly, a strategist at Barclays, in a Monday research briefing.
Escalating inflation had in March left Fed policymakers minded to lift interest rates in larger-than-usual increments on “one or more” occasions during the months ahead, and also prompted them to make plans for a large and potentially imminent reduction of the bank’s balance sheet size.
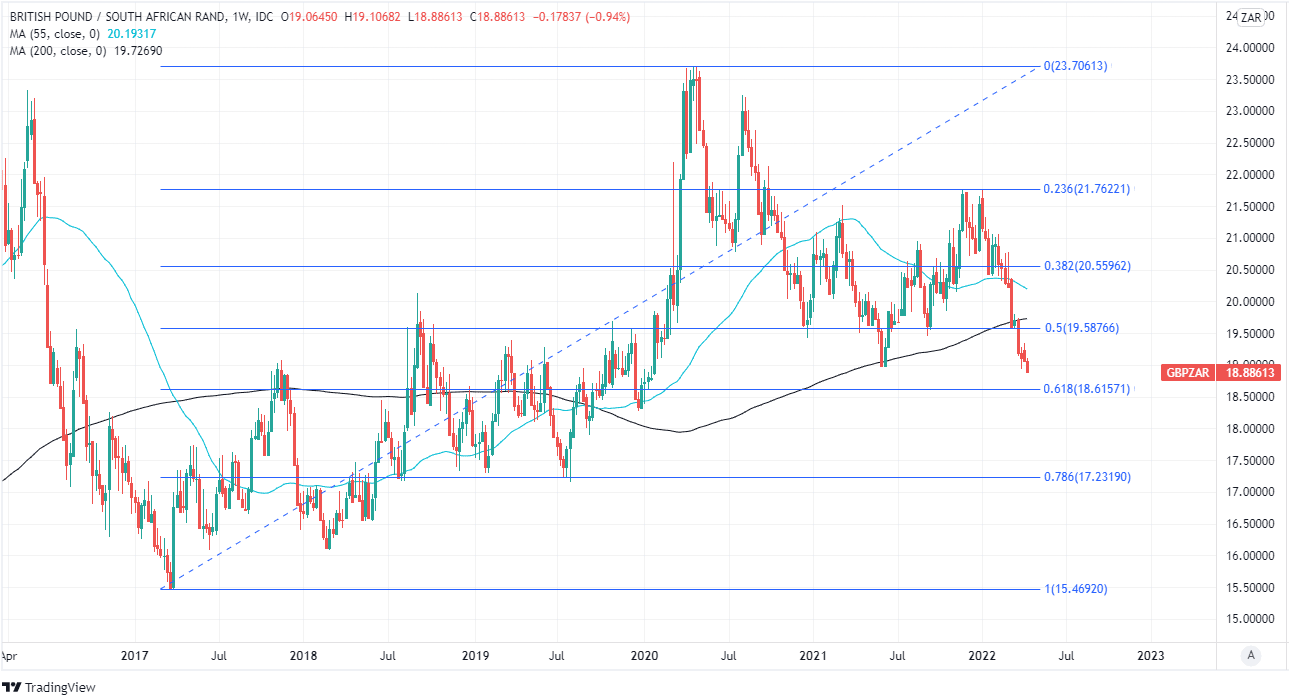 Above: GBP/ZAR shown at weekly intervals with Fibonacci retracements of 2017 uptrend indicating possible areas of medium-term technical support for Sterling. Click image for closer inspection.
This has driven a surge in U.S. bond yields and been a source of intense pressure for many currencies, which may be partly why the U.S. Dollar fell as the Rand and other currencies rose in the wake of Tuesday’s inflation data.
Dollar declines and Rand strength saw USD/ZAR making a bid for its late November low beneath 14.50 on Tuesday in price action that also had the effect of pulling the Pound to Rand exchange rate beneath an important level of technical support on the charts.
This leaves little in terms of technical impediments standing between GBP/ZAR and its lowest levels since October 2019 but much about the outlook for it is dependent on the broader trend in the U.S. Dollar, and some analysts have warned that this could still have further to rise.
“Unfortunately, the descent will be long and slow given lingering supply chain issues, significant tightness in the labour market and ongoing corporate pricing power. This means the Fed needs to raise rates rapidly,” says James Knightley, chief international economist at ING.
“This will come with an economic cost. Higher borrowing costs, a strong dollar and a potentially fraught political backdrop as we head towards the November mid-terms means that the US economy will face intensifying headwinds,” Knightley also said on Tuesday.