Image © Natanael Ginting, Adobe Stock
- GBP/ZAR indicating trend turn
- Bullish wedge adds further weight to evidence
- 50-day MA blocking progress and must be vaulted
The Pound-to-Rand exchange rate is trading at 18.10, at the time of writing, as it continues to extend its short-term uptrend begun at the start of December. Although it is slightly weaker on the day, the general current is pushing the market higher.
The pair also appears to have reversed trend after bouncing off a major trendline, as shown on the weekly chart below.
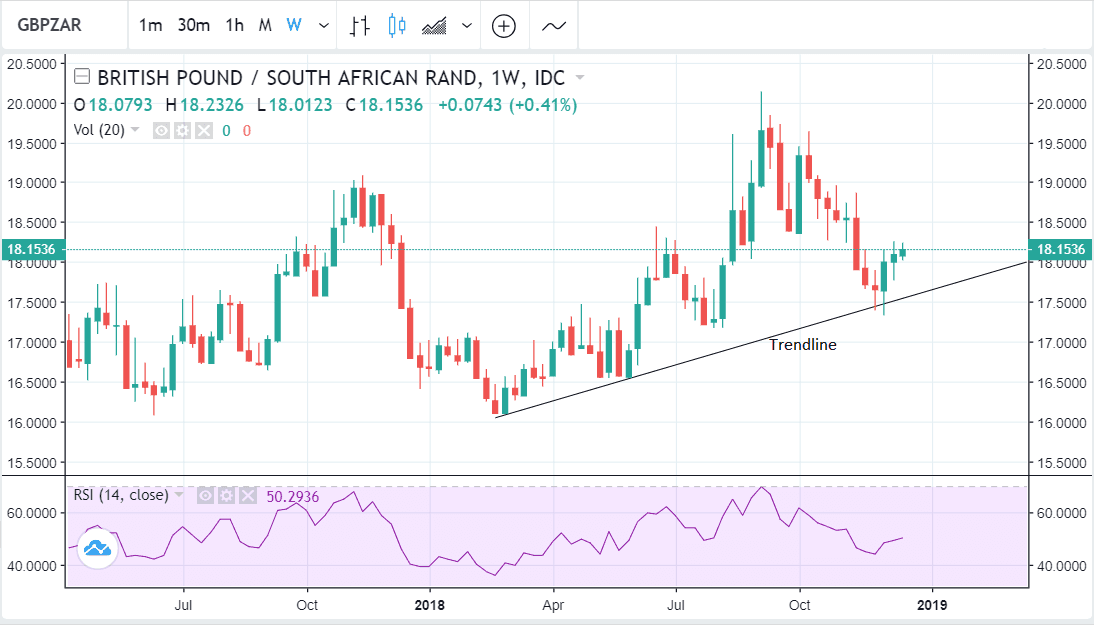
It is still quite early to determine whether this bounce represents a real change of trend or just a temporary pull-back but the evidence suggests there is a strong chance it could represent a change of trend.
The four-hour chart, for example, shows that the pair has now successfully established a new sequence of peaks and troughs higher. This is the first sign a trend may be changing. The trend turning point occurs after two or more higher highs (HH) and higher lows (HL) as is the case with the chart below.
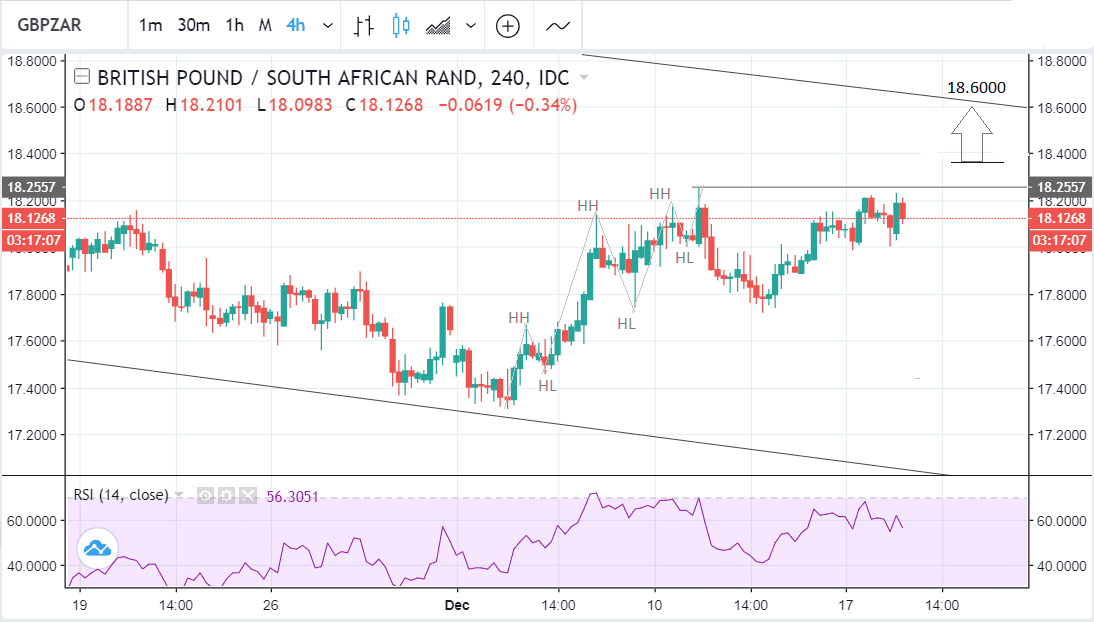
Yet there are obstacles to an extension higher, not immediately visible on the above charts. The location of the 50-day moving average (MA), for example, only slightly above the 18.25 highs at 18.28 is likely to present a tough obstacle to further upside progress and ideally, we would wish to see a clear break above before automatically expecting an extension higher.
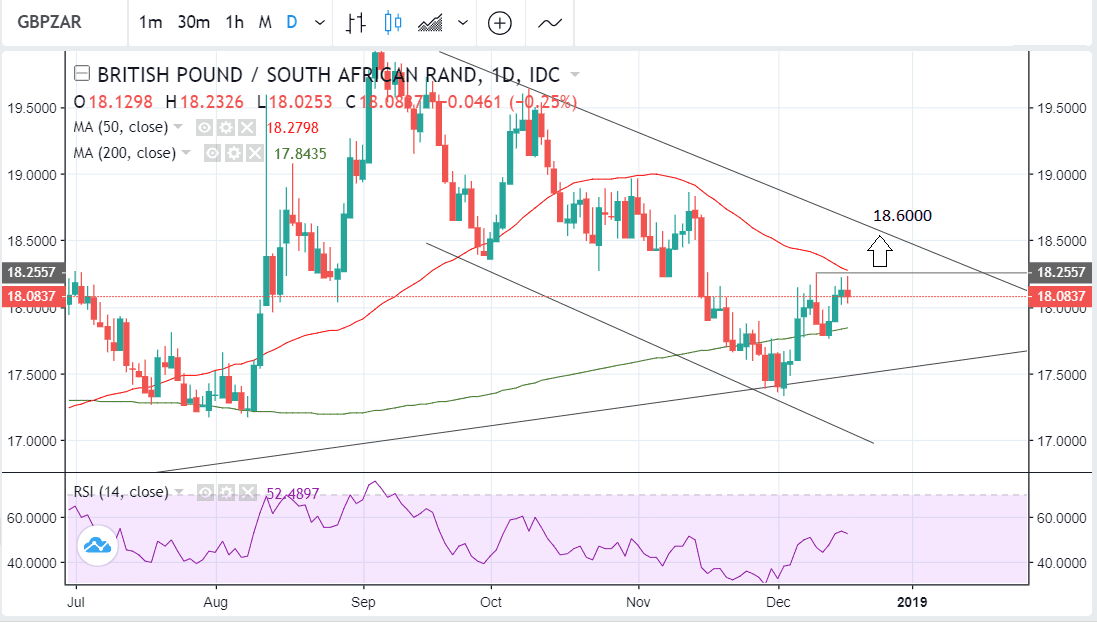
Even so, a break above 18.35 would probably confirm more upside to the next target at 18.60.
Momentum is also supporting more upside on the daily chart as the RSI indicator in the lower pane is at a similar level to where it was at in the first half of November when the exchange rate was in the upper 18s. This could indicate ‘pent-up’ bullish potential.
GBP/ZAR has also formed a wedge pattern which potentially could signify more upside in the medium-term. Bullish wedges tend to breakout higher and lead to a strong move to the upside, which in this case would probably indicate a move up into the 20s eventually.
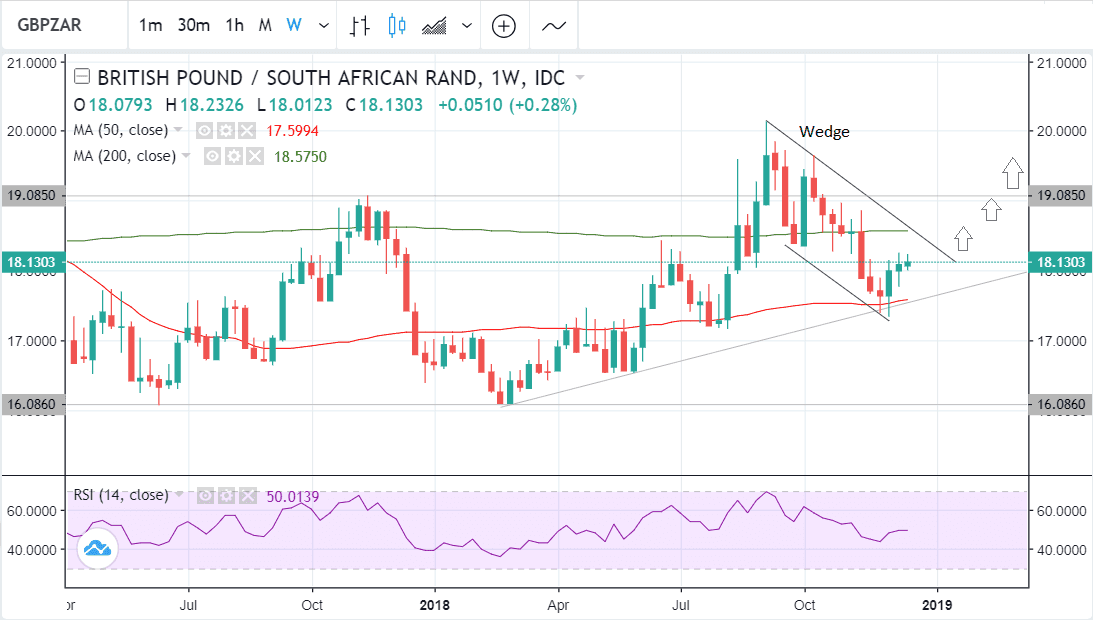
Two major obstacles stand in the way of a continuation higher from a breakout of the wedge, however, and include the 200-week moving average (MA) at 18.57, and the 2018 highs at 19.08.
The pair is one of the few Sterling rates to be lower on the day after the Pound rose due to diminishing chances of a ‘no-deal’ Brexit. This came after the EU dismissed the idea of working with the UK to coordinate a ‘managed no-deal’ Brexit in March, which reduced the chances of such a scenario materialising.
The reason the pair may be lower is perhaps because the Rand recently gained a boost from a brighter growth outlook after Q3 GDP data showed stronger-than-expected growth of 2.2% versus 1.6% forecast. This also broke the run of two quarters of negative growth and pulled the country out of a technical recession.
Advertisement
Bank-beating GBP/ZAR exchange rates. Get up to 5% more foreign exchange by using a specialist provider to get closer to the real market rate and avoid the gaping spreads charged by your bank when providing currency. Learn more here